The IAB Dashboard: A Quick View of Overall Group-level Results
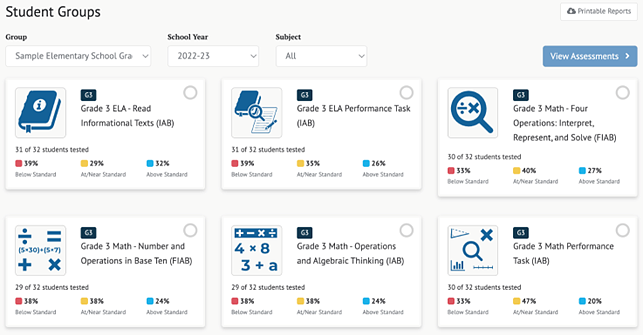
The CERS IAB Dashboard provides educators with a quick view of overall results for the IABs administered to a group of students. A teacher can view the score distribution for each interim to see the percentage of students who performed in each reporting category (Above, Near, and Below Standard) as shown in figure 1 below. The teacher can also see which IABs were completed by all students in the group.

Figure 1. IAB Dashboard
The teacher can see from the IAB Dashboard that not all 32 students in the class completed each IAB. The score distributions for each interim show overall group performance so the teacher can quickly see on which IABs students did well and where they did not do well. The teacher can see more detailed information about student performance.

