Test Progress Summary Option
The Test Progress Summary Report uses the data from the Test Completion Rates Report to present the completion data from the TDS graphically. Bar graphs are divided into contrasting colors that show completed, in progress, and not started sections for the open test windows.
The Test Progress Summary option can generate reports by LEA or school. Take the following steps to generate this report:
-
Select the Test Progress Summary option from either the Home Page Dashboard screen or the Test Progress Reports drop-down list (indicated in figure 1).

Figure 1. Test Progress Summary option in the Test Progress Reports drop-down list
-
When the Test Progress Summary opens, the “Open Test Windows” section shows summaries of testing progress for CAASPP and ELPAC for the default “ALL SCHOOLS” student group. Select the [Change Report Type] button to select an individual school (indicated in figure 2).
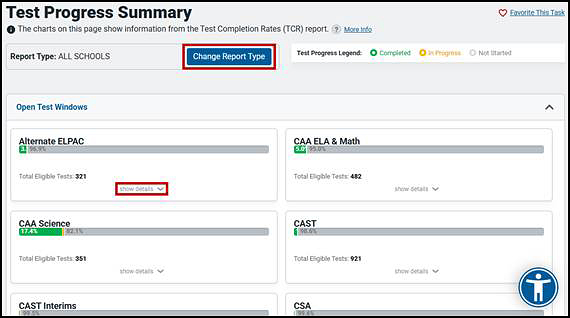
Figure 2. Sample Test Progress Summary Report
- Take other actions to adjust the content reported:
-
Select a [show details] link—also indicated in figure 2—under a graph to expand a section that shows the graph for the school and provides an option to expand the viewing area under the graph to view the progress data by LEA, schools within the LEA, or the test site table (figure 3).
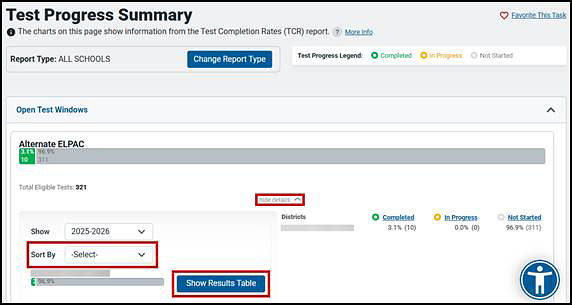
Figure 3. Expanded details for the Summative Alternate ELPAC Test Progress Summary sample
- Select the [hide details] link (indicated in figure 3) to collapse this view.
- Select the [Show Results Table] (also indicated in figure 3) to expand the view to include an assessment’s results table that shows an LEA coordinator the progress data for all the schools selected for viewing and shows a site coordinator the progress data for just that school.
- Select the [Hide Results Table] button to collapse this view (not shown).
- Select criteria in the Sort By drop-down list (also indicated in figure 3) to sort the list of schools in descending order by Most Complete, Most In Progress, or Most Not Started.
- Select the [show all details] button at the very bottom of the page to display details for all the listed assessments. Select it again when it has toggled to [hide all details] to hide the details (not shown).
-
Refer to the Column Definitions subsection of the Plan and Manage Testing, Search by SSID, and Progress Summary Reports section for a description of the columns in the results table.