Test Completion Rates Reports
LEA- and school-level users may generate a Microsoft Excel spreadsheet that can be uploaded into most data analysis programs and displays the total number of currently enrolled students who are active in the TDS and have started and completed each assessment. The spreadsheet also provides information about the number of students associated with the selected entity. The reports are generated using the instructions in the Test Completion Rates Option section and described in table 1. These reports can be generated at different user levels for all assessments or for one specific assessment.
Features
| Report Type | Description | Access |
|---|---|---|
|
District Test Completion Rates |
This report contains data for the selected LEA. |
LEA-level users may generate a report for the LEA(s) with which they are associated in TOMS. |
|
School Test Completion Rates |
This report contains data for the selected school or for all the schools in the selected LEA. |
LEA-level users may generate this report for all schools under the LEA’s jurisdiction, while school-level users may generate a report for the school(s) with which they are associated in TOMS. |
Figure 1 is a sample of a portion of an LEA-level Test Completion Rates spreadsheet report.
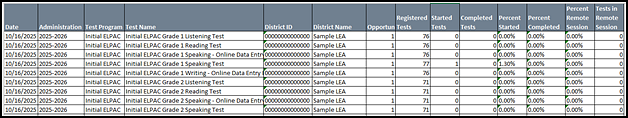
Figure 1. Sample Test Completion Rates Report for assessments within the LEA
Column Definitions
Table 2 lists the column descriptions in the report that is produced.
| Column | Description |
|---|---|
|
Date |
The date and time that the report was generated |
|
Administration |
Test administration year (Only the current test administration year is reported.) |
|
Test Program |
Testing program |
|
Test Name |
The grade level, assessment, and subject or domain that are being reported |
|
District ID |
The CDS code of the reported LEA |
|
District Name |
The name of the reported LEA |
|
School ID |
The CDS code of the reported school
|
|
School Name |
The name of the reported school
|
|
Opportunity |
The test opportunity number that is being reported
|
|
Registered Tests |
The number of assessments for which currently enrolled students associated with the LEA or school in TOMS have been registered
|
|
Started Tests |
The number of assessments that have been started |
|
Completed Tests |
The number of currently enrolled students who have finished the assessment and submitted the assessment for scoring
|
|
Percent Started |
The percentage of students who have started the assessment out of the total number of students registered with the LEA or school in TOMS to take the assessment |
|
Percent Completed |
The percentage of students who have completed the assessment, whether in person or remotely, out of the total number of students registered with the LEA or school in TOMS to take the assessment |
|
Percent Remote Session |
The percentage of the total number of students who tested remotely divided by the total number of students who completed a particular assessment (for example, grade eight CAST) |
|
Tests in Remote Session |
The total number of students who completed testing in a remote session |