CAASPP Smarter Balanced and California Science Test Content
Sample SSR
Sample SSRs are provided here. The callouts on the samples correspond with the links in the numbered list. Select a link for more information about that section of the SSR.
Data displayed on the samples in this guide are for demonstration purposes only and may not reflect valid data. Sample SSRs may include minor variances from actual SSRs.
Refer to the Smarter Balanced Reporting Criteria and CAST Reporting Criteria subsections for information about the criteria required for a student to receive an SSR.
Page 1
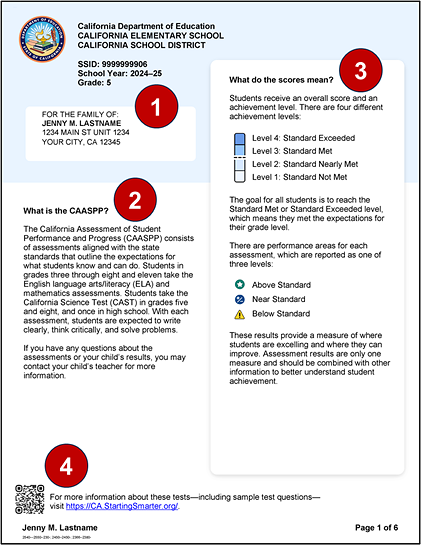
Figure 1. Sample CAASPP Smarter Balanced and CAST SSR, page one
Page 2 (ELA)
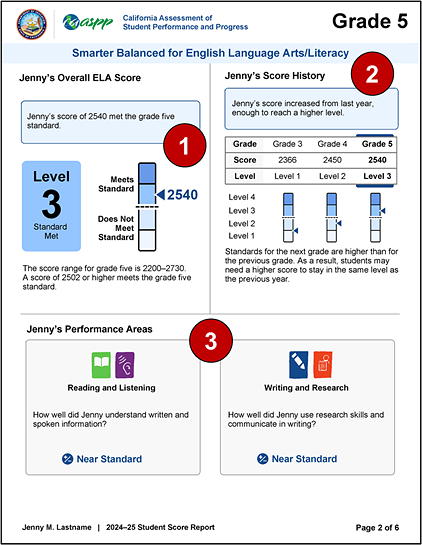
Figure 2. Sample CAASPP Smarter Balanced and CAST SSR, ELA, page two
Page 3 (Mathematics)
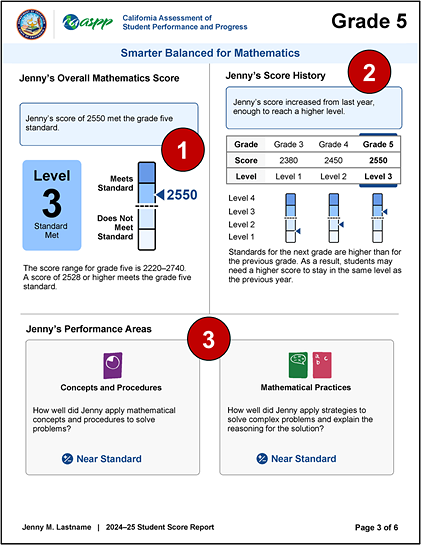
Figure 3. Sample CAASPP Smarter Balanced and CAST SSR, mathematics, page three
Page 4
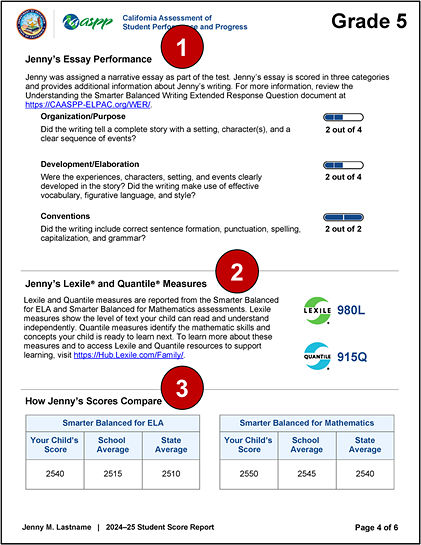
Figure 4. Sample CAASPP Smarter Balanced and CAST SSR, additional measures, page four
Page 5 (CAST)
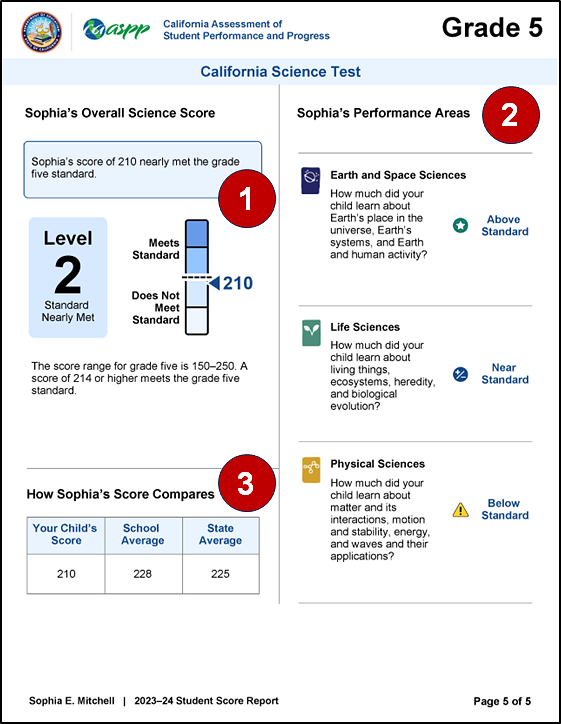
Figure 5. Sample CAASPP Smarter Balanced and CAST SSR, science, page five
Page 6 (Blank)
Figure 6. Sample CAASPP Smarter Balanced and CAST SSR, blank, page six
Description
The SSR for the Smarter Balanced Summative Assessments for ELA and mathematics and CAST is described in table 1.
| Feature | Description |
|---|---|
|
Purpose |
This SSR shows a student’s achievement on CAASPP System assessments to students and parents/guardians and presents the student’s results for ELA, mathematics, and science. |
|
Format |
|
|
Action |
Pursuant to 5 CCR Section 863, LEAs must notify parents/guardians and make CAASPP SSRs available within 20 working days of their delivery to the LEA in TOMS. If the LEA receives the SSRs after the last day of instruction for the school year, the LEA shall make the SSR available to the parent/guardian no later than the first 20 working days of the new academic year. |
Data presented for the Smarter Balanced Summative Assessments for ELA and mathematics includes the following:
- Scale scores
- Achievement levels:
- Level 4—Standard Exceeded
- Level 3—Standard Met
- Level 2—Standard Nearly Met
- Level 1—Standard Not Met
- Scale scores and achievement levels for two previous years’ assessments (if available)
- Comparison data with school and state averages
- Composite performance area levels:
- Above Standard
- Near Standard
- Below Standard
- WER scores
- Lexile and Quantile measures
Data presented for CAST includes the following:
- Scale scores
- Achievement levels:
- Level 4—Standard Exceeded
- Level 3—Standard Met
- Level 2—Standard Nearly Met
- Level 1—Standard Not Met
- Scale score ranges
- Comparison data with school and state averages
- Performance area levels:
- Above Standard
- Near Standard
- Below Standard
Front Page
The front page of an SSR always contains the student information and additional resources described in the Common CAASPP and ELPAC SSR Page 1 General Information section in addition to the content described in the rest of this subsection.
What Is the CAASPP?
Each SSR contains a brief program overview and describes the specific content-area assessments whose results are reported. Figure 7 shows an example for an SSR with CAASPP Smarter Balanced for ELA and mathematics and CAST results.
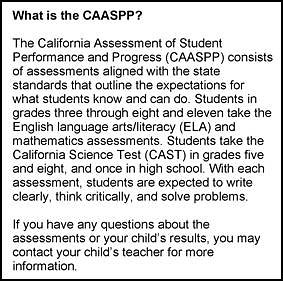
Figure 7. Program overview
What Do the Scores Mean?
Reporting for the CAASPP Smarter Balanced and CAST includes four achievement levels that are in the following order from top to bottom:
- Level 4—Standard Exceeded
- Level 3—Standard Met
- Level 2—Standard Nearly Met
- Level 1—Standard Not Met
Performance levels for the performance areas are presented as one of three levels:
- Above Standard (green star icon)
- Near Standard (blue plus/minus icon)
- Below Standard (yellow exclamation point icon)
However, when a student does not respond to enough items in that performance area, the performance area score is “No Score Available” with the message, “†There were not enough questions answered to report [Student’s name]’s achievement in all performance areas.”
Because each assessment is aligned with a specific set of academic standards, scores cannot be compared between assessments for different content areas (for example, one cannot compare results between the ELA and science assessments) or between the CAASPP and assessments administered previously in California (such as for the Standardized Testing and Reporting Program).
Each SSR contains a brief description of the achievement levels for the overall assessment and performance levels. Figure 8 shows an example for an SSR with CAASPP Smarter Balanced for ELA and mathematics and CAST results.
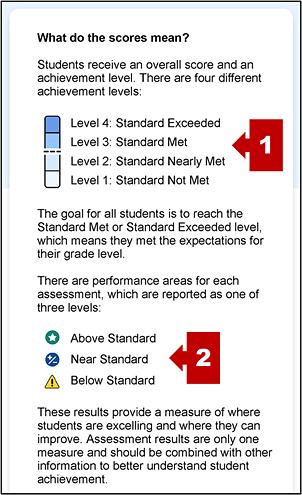
Figure 8. Scores information
| # | Feature | Description |
|---|---|---|
|
1 |
Achievement level measurement gauge |
A gauge is divided into four parts, each representing one of the achievement levels, from Level 1 to Level 4. An indicator with the student’s score places the score within one of the four achievement levels. |
|
2 |
Performance levels |
A list of performance levels for either composite claims (ELA and mathematics) or science domains (CAST) is presented. |
Score Overview
The combined CAASPP SSR that reports Smarter Balanced for ELA and mathematics and CAST results contains common elements.
Score ranges for each achievement level are different for each grade level, and the standards for the next grade level are more challenging than for the previous grade level. As a result, an increase in the overall scale score may not mean a higher achievement level for the current year.
Under certain circumstances, such as when results are associated with a condition code or an assessment was invalidated, a message will appear on the SSR. Possible messages, their associated condition codes, and the applicable content-area assessment are presented in table 3. Refer to the Condition Code Descriptions section in Interpreting Results for information about when a condition code applies.
| Content Area | Condition Code | Message |
|---|---|---|
|
All |
Invalid |
If the student’s test result is invalidated, the score is accompanied by a footnote: [Student’s name]’s scores should be used with caution as the test was administered under conditions that may not represent [Student’s name]’s achievement. |
|
All |
LOSS |
If a LOSS condition code is applied to a student’s result, the LOSS is accompanied by a footnote: [Student’s name]’s scores should be used with caution as the test was administered under conditions that may not represent [Student’s name]’s achievement. |
|
ELA |
NEL |
[Student’s name] was exempt from taking the English language arts/literacy assessment during this school year. |
|
All |
NS |
[Student’s name] started the test but did not answer any questions. |
|
All |
NT |
[Student’s name] did not take the [content area] assessment. For additional information, please contact [Student’s name]’s teacher(s) or school. |
|
All |
NTE |
[Student’s name] did not complete the [content area] assessment because of a medical emergency. |
|
All |
PGE |
[Student’s name] did not complete the [content area] assessment because of a parent or guardian exemption. |
Overall Content-Area Score
This section, which is presented in figure 9, shows the student’s score relative to the score range for the assessment. Student achievement is indicated in text and in a measurement gauge.
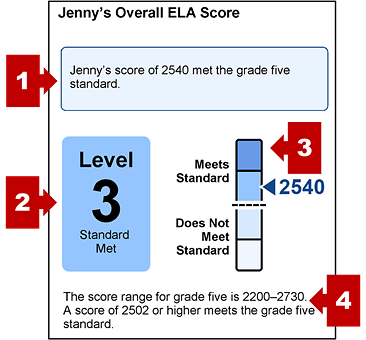
Figure 9. Overall content-area score
| # | Feature | Description |
|---|---|---|
|
1 |
Performance statement |
This statement notes the student’s score and how well the student demonstrated their mastery of the state standards for the grade level and content area. Summaries are listed in the Performance Summary Text subsection. |
|
2 |
Overall achievement level |
This indicator summarizes the student’s achievement level for the content-area assessment. If the student did not test, the achievement level number is replaced here with “Not Tested.” |
|
2 |
Not tested (Not shown) |
If present, additional text will be included in the progress summary section for the content area if the student did not receive a score, either because the student did not take the assessment, the student was exempt from taking an ELA assessment, or the student logged on but answered no items. |
|
3 |
Achievement level measurement gauge |
A gauge is divided into four parts, each representing an achievement level. An indicator with the student’s score places the score within its corresponding achievement level. |
|
4 |
Score range |
This statement notes the score range for the content-area, grade-level assessment and minimum score for meeting the standard. |
Performance Summary Text
This section also includes performance summary text. Performance summary outcomes for students are as follows:
- [Student’s name]’s score of [score] did not meet the [grade level] standard.
- [Student’s name]’s score of [score] nearly met the [grade level] standard.
- [Student’s name]’s score of [score] met the [grade level] standard.
- [Student’s name]’s score of [score] exceeded the [grade level] standard.
Score History (ELA and Mathematics Only)
Scores are presented for a student’s prior two results on the CAASPP Smarter Balanced for ELA and mathematics. Note the following about this section, which is presented in figure 10:
- “Not Tested” appears if a student does not have a score for a particular year (grade level).
- A score history is not shown for a student in grade three, who is taking a Smarter Balanced Summative Assessment for the first time; or a student in grade eleven.
-
A progress summary is not shown if there is no score for the student in the current or prior year.
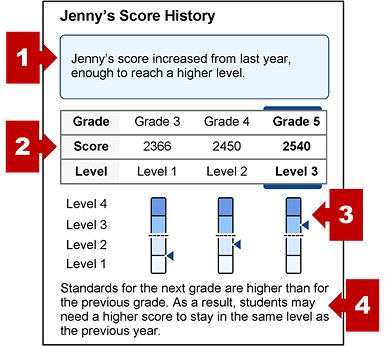
Figure 10. Student score history
| # | Feature | Description |
|---|---|---|
|
1 |
Progress summary |
This paragraph describes the student’s progress based on the student’s achievement level for the content area. Summaries are listed in the Progress Summary Text subsection. |
|
4 |
Special condition (Not shown) |
A cautionary message also will be included under the progress summary for one of the following reasons:
|
|
2 |
Score history table |
Student scores and achievement levels are presented in a table that shows, from left to right, the student’s score two years ago, one year ago, and as reported for the current test administration year. If the student is in grade three, this table will be replaced with the message, “[Name] took this test for the first time this school year. [Name] will have score history next school year.” If the student is in grade eleven, this table will be replaced with information about the EAP. |
|
3 |
Achievement level measurement gauges |
Gauges with an arrow showing the student’s achievement level within one of the four sections for each of the reported test administrations are presented immediately under the table in columns that align with the grade level reported. |
|
4 |
Achievement description |
A paragraph explains where the student’s achievement level stands relative to the next level on a gauge and that standards will be higher for the next grade level. |
Progress Summary Text
This section includes text noting if the student exceeded, met, nearly met, or did not meet the grade level’s achievement standard. This section also includes progress summary text for students in grades three through eight comparing the current year’s results with the previous year’s results and noting whether the student stayed within the previous year’s achievement level. Possible progress summary text for students is as follows:
- [Student’s name]’s score decreased from last year, and is now in a lower level.
- [Student’s name]’s score decreased from last year, but is still in the same level.
- [Student’s name]’s score increased from last year, enough to reach a higher level.
- [Student’s name]’s score increased from last year, but not enough to stay in the same level.
- [Student’s name]’s score increased from last year, and is still in the highest level.
- [Student’s name]’s score increased from last year, but not enough to reach a higher level.
- [Student’s name]’s score did not increase from last year, and is now in a lower level.
- [Student’s name]’s score did not increase from last year, and is still in the same level.
Early Assessment Program for Grade Eleven
Students in grade eleven will not have a Score History section. Instead, this section includes a description of the Early Assessment Program (EAP), a joint program of the CDE and CSU. A paragraph describes how the EAP can provide an early indicator of college academic preparation and a URL for the Early Assessment Program web page that contains additional information about the EAP.
Performance Areas
Performance areas identify knowledge and skills being measured through a set of items. For the Smarter Balanced Summative Assessments for ELA and mathematics, the performance areas represent the Smarter Balanced claims in each content area. For CAST, the performance areas represent the science domains.
Groups of items in each combination of grade level and content area are formed on the basis of related content standards. A performance area result is a measure of a student’s performance on the items in that area of the assessment.
Beginning with the 2020–21 test administration, California adopted the adjusted-form blueprints for the Smarter Balanced Summative Assessments for ELA and mathematics. The adjusted-form blueprints reduced the number of items on each assessment which, in turn, reduced testing time for students and schools while providing a valid measure of student achievement in ELA and mathematics. As a result of the fewer number of items on assessments using the adjusted-form blueprints, individual performance area results cannot be reported on SSRs. Instead, SSRs include composite area results.
For ELA, the Reading and Listening claims are combined into a single Reading and Listening composite area, while the Writing and Research claims are combined into a single Writing and Research composite area. For mathematics, the Concepts and Procedures claim remains the same while the other three claims are combined into a single Mathematical Practices composite area.
The composite performance areas reported on the SSR are as follows:
- ELA Composite Performance Areas:
- Reading and Listening
- Writing and Research
- Mathematics Composite Performance Areas:
- Concepts and Procedures
- Mathematical Practices
For CAST, SSRs include performance area results for the following science domains:
- Earth and Space Sciences
- Life Sciences
- Physical Sciences
Performance levels are presented as one of three levels (figure 11):
- Above Standard (green star icon)
- Near Standard (blue plus/minus icon)
- Below Standard (yellow exclamation point icon)
When there is “No Score” for a performance area, there is a dagger symbol and an accompanying footnote.
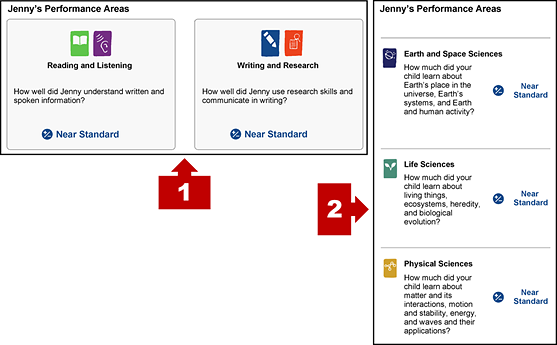
Figure 11. Performance area scores
| # | Feature | Description |
|---|---|---|
|
1 |
Smarter Balanced composite performance area results |
This section appears on the ELA and mathematics scores pages. |
|
2 |
CAST performance area results |
This section appears on the CAST score page. |
Essay Performance (ELA Only)
WER items (full-write response) required students to write one or more paragraphs. The WER is scored for three writing traits: Organization and Purpose, Evidence and Elaboration, and Conventions. A student receives a score from 1–4 on the traits Organization/Purpose and Development/Elaboration and from 0–2 for Conventions. A gauge indicates the student’s score for each of these, as shown in figure 12.
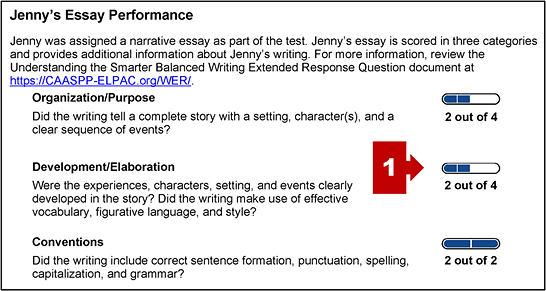
Figure 12. Essay performance
| # | Feature | Description |
|---|---|---|
|
1 |
WER score gauges |
These gauges, divided into either two or four parts, indicate the student’s WER score. |
Lexile and Quantile Measures (ELA and Mathematics Only)
Lexile and Quantile measures provide additional measures of students’ abilities in reading and mathematics. Lexile measures indicate students’ reading abilities, and Quantile measures indicate students’ readiness for instruction in mathematics.
The Lexile and Quantile Measures section of the SSR features metrics for reading and mathematics that were calculated based on the student’s Smarter Balanced scale scores for ELA and mathematics, respectively. A Lexile measure indicates the difficulty of materials a student can read and understand independently. A Quantile measure shows what mathematical skills a student has mastered and in which skills the student needs additional instruction.
Lexile and Quantile measures can be used by parents/guardians at the web addresses on the report to identify suitable books to support the student’s reading level; and activities and other resources to support the student’s mathematics knowledge and skill.
Data presented for the Lexile and Quantile measures includes the following on each of the SSRs (figure 13):
- A Lexile measure for reading linked to the student’s Smarter Balanced for ELA score
-
A Quantile measure for mathematics linked to the student’s Smarter Balanced for Mathematics score
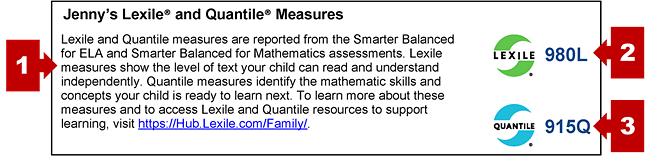
Figure 13. Lexile and Quantile measures
| # | Feature | Description |
|---|---|---|
|
1 |
Information and additional resources |
This section describes where to find additional information about the Lexile and Quantile measures and how to use them. It includes the URL for the Lexile® & Quantile® Hub, where appropriate book titles, vocabulary lists, and mathematics activities can be found. |
|
2 |
Lexile measure |
This section features the number representing the student’s Lexile measure for reading. The higher the number, the stronger the student’s reading performance. Note that results starting with “BR” indicate a beginning reader’s Lexile measure, and an asterisk indicates that the student’s measure should be used with caution. |
|
3 |
Quantile measure |
This section features the number representing the student’s Quantile measure for mathematics. The higher the number, the stronger the student’s mathematical performance. Note that results starting with “EM” indicate an emerging mathematician’s Quantile measure, and an asterisk indicates that the student’s measure should be used with caution. |
Score Comparisons
Score reports for Smarter Balanced for ELA and mathematics and CAST compare the student’s content-area score with the average score at the school and within the state of California (figure 14).
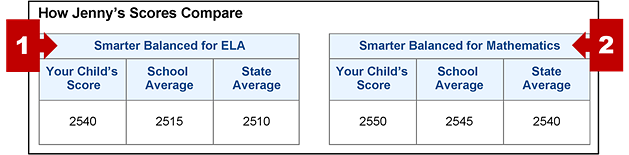
Figure 14. Score comparisons tables
| # | Feature | Description |
|---|---|---|
|
1 |
Content area (ELA and mathematics only) |
The content area—if ELA and mathematics—appears in the top row of the score comparison table. (This is not present for CAST because the CAST SSR is on its own page.) |
|
2 |
Score comparison table |
A table provides the score for the content-area assessment for the student, school, and state. |