Smarter Balanced Interim Comprehensive Assessments (ICAs)
The user interface for the Interim Comprehensive Assessments (ICAs) functions similarly to Interim Assessment Blocks (IABs) in many aspects.
ICA Results in Group View
The group view provides an aggregate and individual display of a selected assessment for an assigned group, a custom group, or a school. Refer to the Home Page or the View Student Group Assessment Results for details.
Once a user selects an ICA to display in the group view, the Results panel for an ICA displays as shown in figure 1. The Results View table for ICA results can be toggled to show Overall or Claim level scores as available for the assessment chosen. Overall is the default selection.
The ICA Results panel (figure 1) contains many of the same elements as the IAB/IA Results panel.
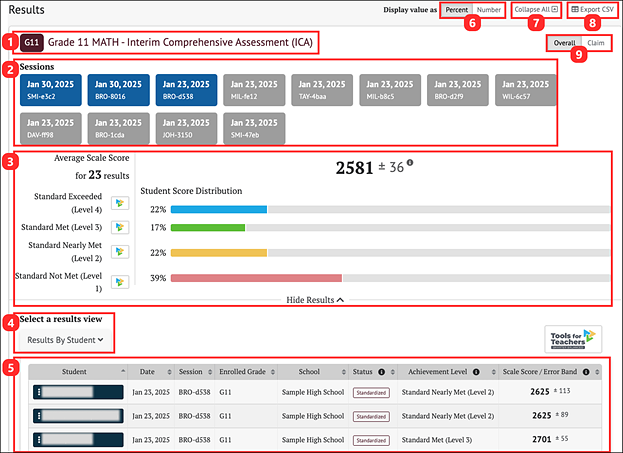
Figure 1. ICA Results Page
Each ICA Results page displays the following information and elements:
- Name and grade of the assessment
- Testing session(s) from which results are displayed. These sessions appear once a test is completed (and scored). Please note that testing sessions appear here for interim assessments only.
- Group Aggregate panel displays aggregate data for the selected groups of sessions
- Select a results view drop-down menu offers the following options for display results:
- [Results By Student] (default view)
- [Results By Item]
- [Key/Distractor Analysis] (for selected-response items)
- [Writing Trait Scores] (for ELA only)
- [Lexile Report] (for ELA only)
- [Quantile Report] (for math only)
- Results View table
- Display value as field: Contains a toggle allowing a user to change the display to show the Student Score Distribution in percentages of students or numbers of students in each reporting category
- [Collapse All] button: Hides the Results by Student table for all the displayed assessments and toggles to an [Expand All] button, which displays the results again
- [Export CSV] button: Export all the student’s test history to a comma-separated value (CSV) file for download.
- [Overall/Claim] toggle: Toggles between results views of Overall and Claim results
ICA Group Results
The ICAs report achievement Overall and by Claim. The group Results page for an ICA is displayed in figure 2.
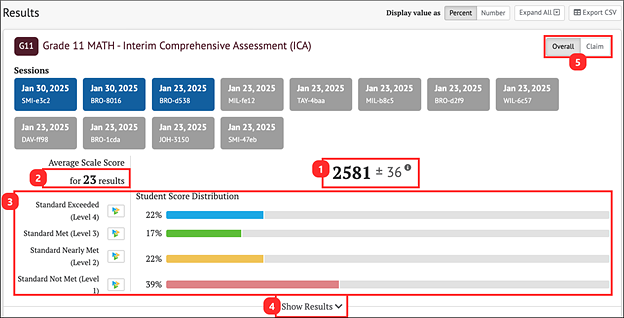
Figure 2. Overall Group Results for ICAs
The Group Aggregate panel for ICA Overall results displays the following information and elements:
- Average Scale Score: Average scale score for the selected group of students and an error band based on the Standard Error of the Mean
- Number of student test results from which the average scale score and score distribution are calculated
- Student Score Distribution: Score distribution for the performance levels of the overall score
- [Show Results] button: Displays the Results View table for the displayed assessment and toggles to a [Hide Results] button that can hide the table
- [Overall/Claim] toggle: for performance scores Overall and by Claim
- The [Overall] toggle displays the Student Score Distribution with four achievement levels.
- The [Claim] toggle displays the claims associated with the subject, each with three reporting categories.
The [Claim] toggle displays four claims, each with three reporting categories (figure 3).
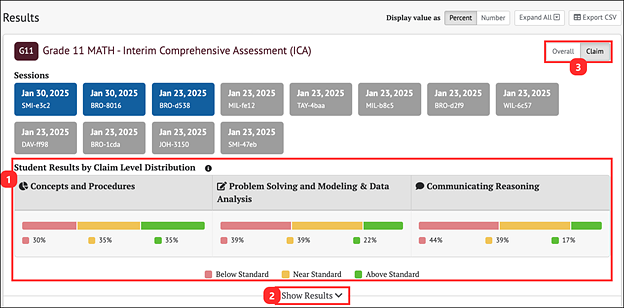
Figure 3. Claim Group Results for an ELA ICA
The Group Aggregate panel for ICA Claim Results displays the following information and elements:
- Student Results by Claim Level Distribution: Displays the claim level distributions for the selected group of students
- [Show Results] button: Displays the Results View table for the displayed assessment and toggles to a [Hide Results] button that can hide the table
- [Overall/Claim] toggle: Switches between the performance scores Overall and by Claim
ICA Results By Student
The Results View panel for ICA results can be toggled to show Overall or Claim results. Overall is the default selection.
ICA Results By Student Overall Scores
When the [Overall] button is selected, the Results View panel includes the information elements for each student (figure 4).
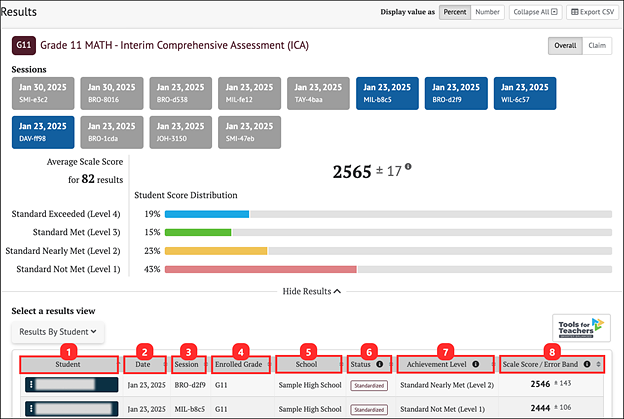
Figure 4. ICA Results By Student Overall Scores
The table includes the following information for each student:
- Student: Student’s full name with a Context Menu three-dot icon [⋮] that provides access to additional student details (refer to the IAB Student Options section)
- Date: Date student completed the assessment
- Session: Testing session identifier
- Enrolled Grade: Student’s enrolled grade at the time of the assessment
- School: Student’s assigned school at the time of the assessment
- Status: The assessment status, which includes whether the assessment administration (Manner of Administration) was Standardized or Non-standardized, or if the assessment was marked Partial or Complete (Completeness)
- Achievement Level: Student’s achievement level on the assessment: Did Not Meet Standard, Nearly Met Standard, Met Standard, or Exceeded Standard
- Scale Score/Error Band: Student’s scale score and score error band based on the Standard Error of the Mean associated with that score
ICA Results By Student Claim
When the [Claim] button is selected, the Results View panel changes to show each student’s assessment results by Claim (figure 5). Return to the default view by selecting the [Overall] button.
The Student Claim Level Distribution table displays the number/percent of students scoring in each reporting category (Below Standard, Near Standard, or Above Standard) for each claim (figure 5).
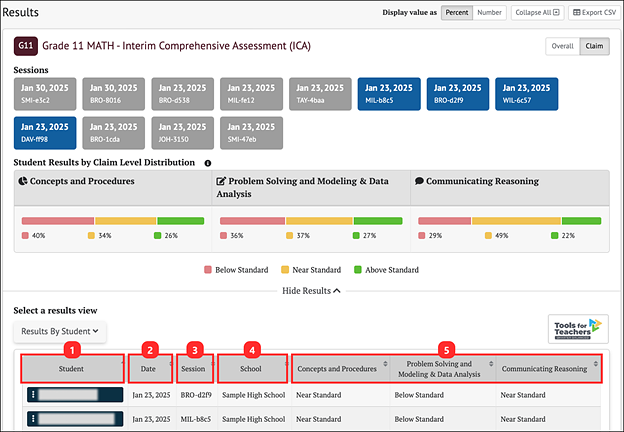
Figure 5. ICA Results By Student Claim
The table includes the following information for each student:
- Student: Student’s full name with a Context Menu three-dot icon [⋮] that provides access to additional student details (refer to the IAB Student Options section)
- Date: Date student completed the assessment
- Session: Testing session identifier
- School: Student’s assigned school at the time of the assessment
- Claims for the selected assessment: Student performance is described as Above Standard, Near Standard, or Below Standard
ICA Writing Trait Scores
When the Writing Trait Scores view is active, the Results panel shows a table with an aggregate view of how the students performed on the writing extended response item. Only items with writing trait information are listed (figure 6).
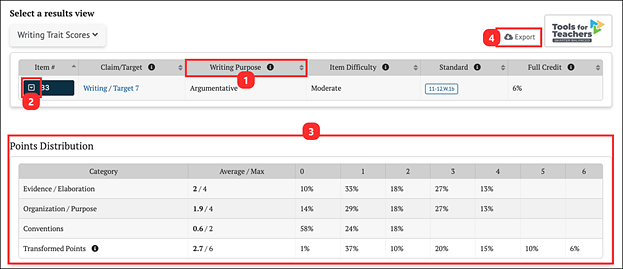
Figure 6. Writing Trait Scores View
The Writing Trait Scores Item table is like the IAB Results By Item table, with the following differences:
- Writing Purpose: A column displays the purpose of the writing tasks (Argumentative, Explanatory, Informational, Narrative, or Opinion).
- [Item drop-down arrow] icon: Selecting an item’s drop-down arrow icon [⌄] expands the row to allow viewing of the item and additional information about the item (refer to the IAB Results by Item Details section).
- Points Distribution table:
- Category: Rows list the category of writing performance or writing trait (Evidence/Elaboration, Organization/Purpose, and Conventions)
- Average/Max: The average and maximum points earned by students in the group for that category.
- 0, 1, 2, 3, etc. : Percentage or number of students who earned each number of points for that category.
- Transformed Points: The final row is for the transformed points calculated from all categories (refer to the CERS Interpretive Guide for an explanation of how transformed points are calculated for Writing Extended Response items).
- [Export] button: Exporting is available to export the report results (both the Results By Item table and the Points Distribution table combined) to a CSV file.
Writing Extended Response (WER) Condition Codes for ELA ICAs
Writing Extended Response (WER) Condition Codes are used for responses to full-write essay items–an example of an ELA performance task–that cannot be scored because of the nature of the student’s response. A detailed description of each available condition code is provided in table 1.
When a student response is assigned a condition code, it is equivalent to a score of zero, except for the Off-Purpose code. In most cases, when a full-write response receives a condition code, that code is assigned to all three dimensions of the response. However, beginning with the 2022en23 test administration, if the condition code for a response is Off-Purpose, only the Evidence/Elaboration and Organization/Purpose dimensions are assigned Off-Purpose, and the Conventions dimension is still scored. The Conventions item score is included in the total ELA score and the writing claim score. The rule for Off-Purpose scoring of Conventions is applied regardless of the genre of the writing prompt.
Writing Extended Response (WER) Condition Codes are available to use in the Teacher Hand Scoring System (THSS) and should be used as applicable.
| Condition Code | Description |
|---|---|
|
Blank (B) |
Student did not enter a response. |
|
Insufficient (I) |
Student has not provided a meaningful response; examples can include
Responses where the student’s original work is insufficient to determine whether the student is able to organize, cite evidence and elaborate, and use conventions as defined in the rubrics; or the response is too brief to determine whether it is on purpose or on topic. |
|
Non-scorable Language (L) |
ELA: language other than English Mathematics: language other than English or Spanish |
|
Off-Topic (T) |
A student response will be judged as off topic when it is unrelated to the task or the sources or shows no evidence that the student has read the task or the sources (especially for informational/explanatory and opinion/argumentative). Off-topic responses are generally substantial responses. |
|
Off-Purpose (M) |
A student response will be judged as off purpose when the student has clearly not written to the purpose designated in the task. An off-purpose response addresses the topic of the task but not the purpose of the task. Off-purpose responses are generally developed responses (essays, poems, etc.) clearly not written to the designated purpose. If the condition code for a response is “off purpose,” only the evidence/elaboration and organization/purpose dimensions are assigned “off purpose,” and the conventions dimension is still scored. |
Lexile® and Quantile® Measures
Lexile® and Quantile® measures and ranges are derived from student scores on the Smarter Balanced ELA and mathematics assessments. CERS contains Lexile measures and ranges for Smarter Balanced ELA summative assessments and ICAs. Quantile measures and ranges are available for Smarter Balanced math summative assessments and ICAs.
Lexile Measures for ELA ICAs
Lexile Measures in Group View
Any group view will provide access to individual student Lexile results by selecting a student’s name and selecting [Student’s Test History] from the context menu. After selecting an ELA ICA, the toggle buttons will include an option to select Lexile results. Refer to the View Student Assessment Results by School and Grade section or the View Student Group Assessment Results section for details.
Once a user selects an ELA ICA to display in the group view, the Results page displays the [Results by Student] view by default. Selecting [Lexile Report] from the Select a results view drop-down list (figure 7) will display the Lexile Report page (figure 8).
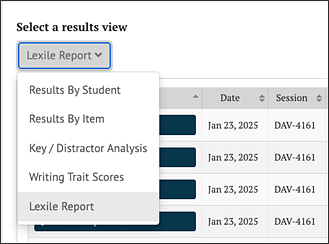
Figure 7. Select a Results View for Lexile Report
When the Select a results view drop-down list is selected, as shown in figure 7, the Lexile Report appears. The options for each view are:
- [Results by Student] (default view)
- [Results By Item]
- [Key/Distractor Analysis]
- [Writing Trait Scores] (for ELA only)
-
[Lexile Report] (for ELA only)
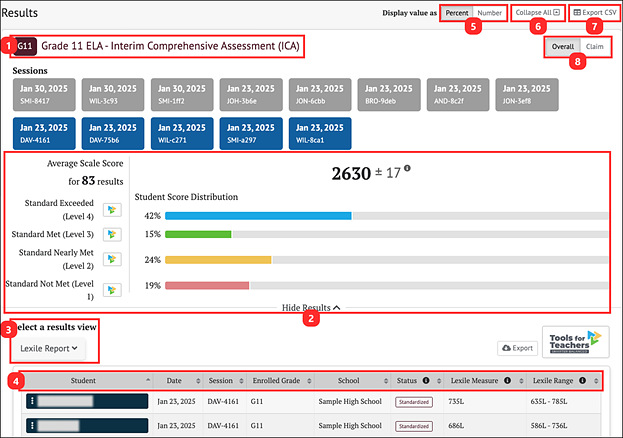
Figure 8. Lexile Report Display
The Lexile Report display for a Smarter Balanced ICA displays the following information and elements:
- The name and grade of the assessment
- The Group Aggregate panel displays aggregate data for the selected group of students
- The Select a results view drop-down menu offers the following options for display results:
- [Results by Student] (default view)
- [Results By Item]
- [Key/Distractor Analysis]
- [Writing Trait Scores] (for ELA only)
- [Lexile Report] (For ELA Only)
- The Results View table
- The Display value as field contains a toggle allowing a user to change the display to show the Student Score Distribution in percentages of students or numbers of students in each reporting category.
- The [Collapse All] button, which hides the Results View table for all the displayed assessments and toggles to an [Expand All] button, which displays the results again
- The [Export CSV] button, which exports all the student’s test history to a comma-separated value (CSV) file for download.
- Toggle buttons to switch between performance scores: [Overall] and [Claim]
- The [Overall] toggle displays the Student Score Distribution with four achievement levels.
- The [Claim] toggle displays four claims with three reporting categories.
Lexile Measure and Range
When the [Lexile Report] is selected, the Results page displays the following information and elements (figure 9).
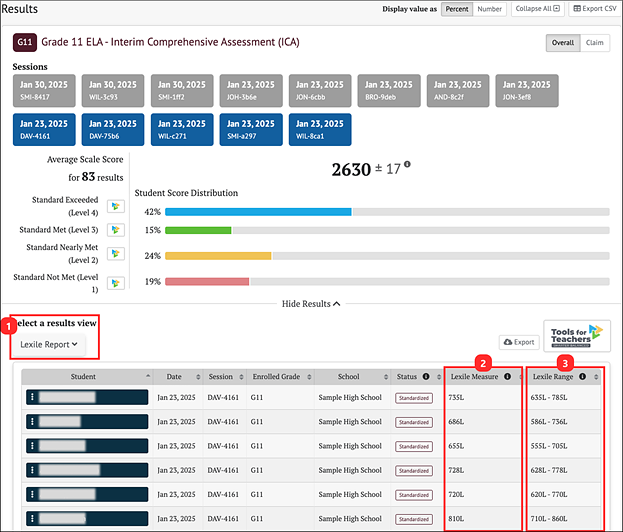
Figure 9. Lexile Measure and Range View
- The Select a results view drop-down menu offers the following options for display results:
- [Results By Student] (default view)
- [Results By Item]
- [Key/Distractor Analysis]
- [Writing Trait Scores] (for ELA only)
- [Lexile Report] (for ELA only)
- Lexile Measure: A student’s Lexile measure represents the student’s ability to read independently on a scale from below 0L to above 1600L.
- Lexile Range: A student’s Lexile range is 50L above and 100L below the student’s Lexile measure.
Lexile Measures By Student
Individual student Lexile results can be accessed from any group view by selecting a student’s name and selecting [Student’s Test History] from the context menu. After selecting an ELA ICA, the toggle buttons will include an option to select Lexile results. Refer to the View Individual Student Results section for more information.
From the Student Test History Page, identify an ELA ICA and select the test results card. Refer to Student Test History Report Results section for more information.
When the [Lexile] toggle is selected, a table with the student’s Lexile measures on the selected assessment is displayed (figure 10).
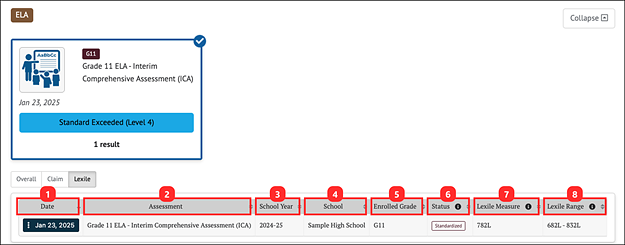
Figure 10. Lexile Measures Table
The Lexile table includes the following information for each student:
- Date: Date student completed the assessment
- Assessment: Name of Assessment
- School Year: School year for assessment
- School: Student’s assigned school at the time of the assessment
- Enrolled Grade: Student’s enrolled grade at the time of the assessment
- Status: For interim assessments, assessment status includes whether the Manner of Administration was Standardized or Non-standardized, or if the assessment was marked Partial or Complete (Completeness). For summative assessments, assessment status only includes whether the assessment administration (Manner of Administration) was Valid or Invalid. An empty field for a summative assessment indicates a valid assessment status. Currently in CERS, all assessment results are reported as valid.
- Lexile Measure: A student’s Lexile measure represents the student’s ability to read independently on a scale from below 0L to above 1600L.
- Lexile Range: A student’s Lexile range is 50L above and 100L below the student’s Lexile Measure.
Quantile Measures for Math ICAs
Quantile Measures in Group View
Any group view will provide access to individual student Quantile results by selecting a student’s name and selecting [Student’s Test History] from the context menu. After selecting a math ICA, the toggle buttons will include an option to select Quantile results. Refer to the View Student Assessment Results by School and Grade section or the View Student Group Assessment Results section for details.
Once a user selects a math ICA to display in the group view, the Results page displays the [Results by Student] view by default. Selecting [Quantile Report] from the Select a results view drop-down list (figure 11) will display the Quantile Report page (figure 12).
Figure 11. Select a Results View for Quantile Report
When the Select a results view drop-down list is selected, as shown in figure 11, the Lexile Report appears. The options for each view are:
- [Results by Student] (default view)
- [Results By Item]
- [Key/Distractor Analysis]
-
[Quantile Report]
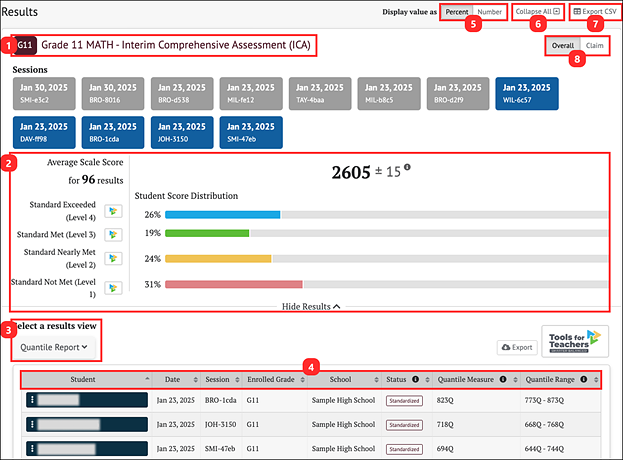
Figure 12. Quantile Report Display
The Quantile Report display for a Smarter Balanced ICA displays the following information and elements:
- The name and grade of the assessment
- The Group Aggregate panel displays aggregate data for the selected group of students
- The Select a results view drop-down menu offers the following options for display results:
- [Results by Student] (default view)
- [Results By Item]
- [Key/Distractor Analysis]
- [Quantile Report] (for math only)
- The Results View table
- The Display value as field contains a toggle allowing a user to change the display to show the Student Score Distribution in percentages of students or numbers of students in each reporting category.
- The [Collapse All] button, which hides the Results View table for all the displayed assessments and toggles to an [Expand All] button, which displays the results again
- The [Export CSV] button, which exports all the student’s test history to a comma-separated value (CSV) file for download.
- Toggle buttons to switch between performance scores: [Overall] and [Claim]
- The [Overall] toggle displays the Student Score Distribution with four achievement levels.
- The [Claim] toggle displays four claims with three reporting categories.
Quantile Measure and Range
When the [Quantile Report] is selected, the Results page displays the following information and elements (figure 13).
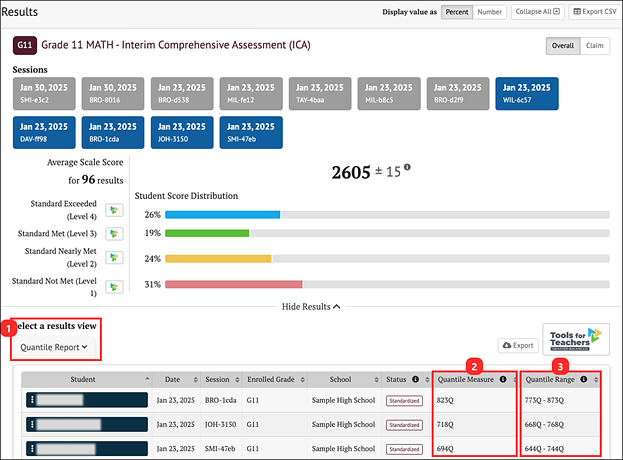
Figure 13. Quantile Measure and Range View
- The Select a results view drop-down menu offers the following options for display results:
- [Results By Student] (default view)
- [Results By Item]
- [Key/Distractor Analysis]
- [Quantile Report] (for math only)
- Quantile Measure: A student’s Quantile measure represents the student’s readiness for mathematics instruction on a scale from below 0Q to above 1600Q.
- Quantile Range: A student’s Quantile range is 50Q above and 50Q below the student’s Quantile measure.
Quantile Measures By Student
Individual student Quantile results can be accessed from any group view by selecting a student’s name and selecting [Student’s Test History] from the context menu. After selecting a math ICA, the toggle buttons will include an option to select Quantile results. Refer to the View Individual Student Results section for more information.
From the Student Test History Page, identify a math ICA and select the test results card. Refer to Student Test History Report Results section for more information.
When the [Quantile] toggle is selected, a table with the student’s Quantile measures on the selected assessment is displayed (figure 14).
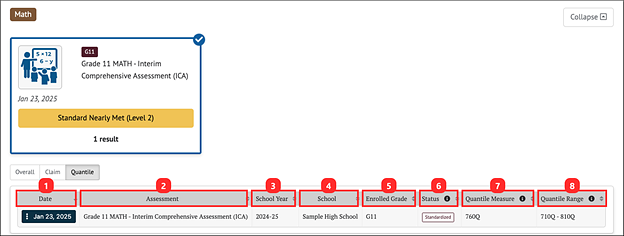
Figure 14. Quantile Measures Table
The Quantile table includes the following information for each student:
- Date: Date student completed the assessment
- Assessment: Name of Assessment
- School Year: School year for assessment
- School: Student’s assigned school at the time of the assessment
- Enrolled Grade: Student’s enrolled grade at the time of the assessment
- Status: For interim assessments, assessment status includes whether the assessment Manner of Administration was Standardized or Non-standardized, or if the assessment was marked Partial or Complete (Completeness). For summative assessments, assessment status only includes whether the assessment administration (Manner of Administration) was Valid or Invalid. An empty field for a summative assessment indicates a valid assessment status. Currently in CERS, all assessment results are reported as valid.
- Quantile Measure: A student’s Quantile measure represents the student’s readiness for mathematics instruction on a scale from below 0Q to above 1600Q.
- Quantile Range: A student’s Quantile range is 50Q above and 50Q below the student’s Quantile measure.