Summative ELPAC Results
Summative ELPAC Results in Group View
The group view for the Summative English Language Proficiency Assessments for California (ELPAC) provides an aggregate and individual display of a selected assessment for an assigned group, a custom group, or a school. Refer to the View Student Assessment Results by School and Grade section or the View Student Group Assessment Results section for details.
Once a user selects a Summative ELPAC to display in the group view, the Results panel displays as shown in figure 1.
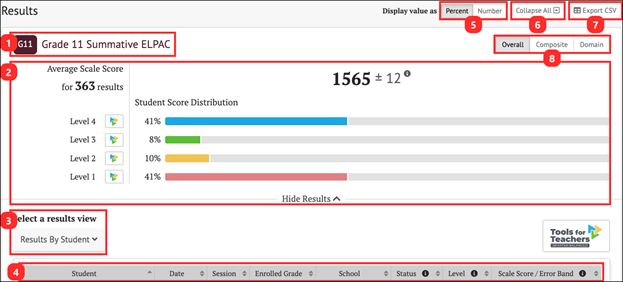
Figure 1. Results Panel for Summative ELPAC
- Name and grade of the assessment
- Group Aggregate panel: Displays the aggregate data for the selected group of students
- Select a results view drop-down menu: Offers the following options for display results:
- [Results By Student]
- Results View table
- Display value as field: Contains a toggle allowing a user to change the display to show the Student Score Distribution in percentages of students or numbers of students in each level
- [Collapse All] button: Hides the Results by Student table for all the displayed assessments and toggles to an [Expand All] button, which displays the results again
- [Export CSV] button: Export all the student’s test history to a comma-separated value (CSV) file for download.
- [Overall/Composite/Domain] toggle: Switches among Overall, Composite, and Domain
- The [Overall] toggle displays the Student Score Distribution with four performance levels.
- The [Composite] toggle displays two composite scores: Oral Language and Written Language, each with four achievement levels.
- The [Domain] toggle displays four domains, each with three reporting categories.
Summative ELPAC Group Results
The Summative ELPAC reports performance levels and scores Overall and by Composite, and performance levels by Domain.
The group Results page for the Summative ELPAC is displayed in figure 2. For Overall results, the [Overall] toggle displays the Student Score Distribution with four performance levels (figure 2).
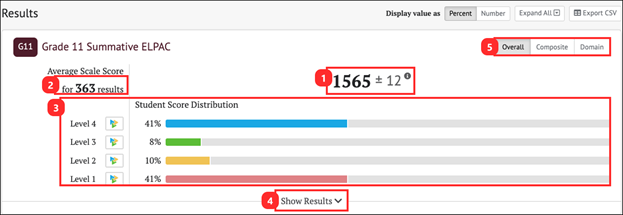
Figure 2. Overall Group Results for Summative ELPAC
The Group Aggregate panel for Summative ELPAC Overall results displays the following information and elements:
- Average Scale Score: Average scale score for the selected group of students and an error band based on the Standard Error of the Mean
- Number of student test results from which the average scale score and score distribution are calculated
- Student Score Distribution: Score distribution for the achievement levels of the overall score
- [Show Results] button: Displays the Results View table for the displayed assessment and toggles to a [Hide Results] button that hides the table
- [Overall/Composite/Domain] toggle: Switches among Overall, Composite, and Domain
The [Composite] toggle displays two composites: Oral Language and Written Language, each with four achievement levels (figure 3).
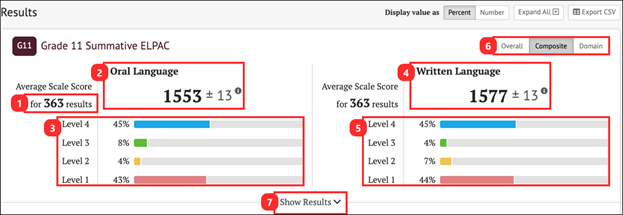
Figure 3. Composite Group Results for Summative ELPAC
The Group Aggregate panel for Summative ELPAC composite results displays the following information and elements:
- Average Scale Score: Number of student test results from which the average scale scores and score distributions are calculated
- Oral Language: Average scale score for Oral Language for the selected group of students and an error band based on the Standard Error of the Mean
- Score distribution for the performance levels of the Oral Language score
- Written Language: Average scale score for Written Language for the selected group of students and an error band based on the Standard Error of the Mean
- Score distribution for the performance levels of the Written Language score
- [Overall/Composite/Domain] toggle: Switches among the performance scores Overall, Composite, and Domain
- [Show Results] button: Displays the Results View table for the displayed assessment and toggles to a [Hide Results] button that hides the table
The [Domain] toggle displays four domains, each with three reporting categories (figure 4).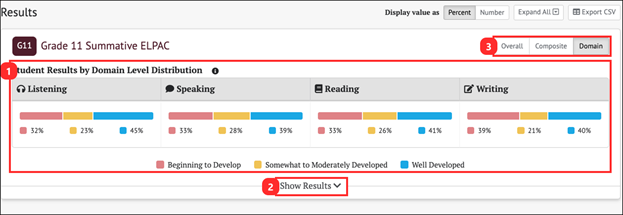
Figure 4. Domain Group Results for Summative ELPAC
The Group Aggregate panel for Summative ELPAC Domain Scores displays the following information and elements:
- Student Results by Domain Level Distribution: Score distributions for each domain for the selected group of students
- [Show Results] button: Displays the Results View table for the displayed assessment and toggles to a [Hide Results] button that hides the table
- [Overall/Composite/Domain] toggle: Switches among the performance scores Overall, Composite, and Domain
Summative ELPAC Results By Student
The Results View for Summative ELPAC results can be toggled to show Overall, Composite, or Domain scores. Overall is the default selection.
Student Overall Scores
When the [Overall] button is selected, the Results By Student table includes the information elements for each student shown in figure 5.
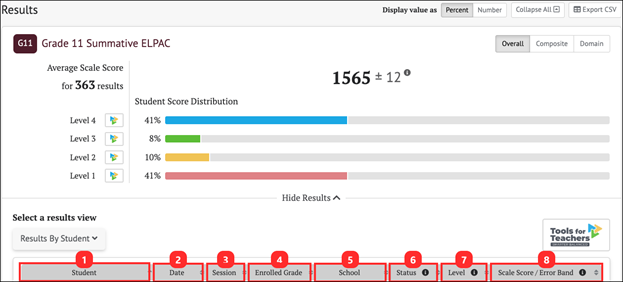
Figure 5. Summative ELPAC Results By Student Overall Scores
The table includes the following information for each student:
- Student: Student’s full name with a Context Menu three-dot icon [⋮] that provides access to additional student details (refer to the Summative Student Options section)
- Date: Date student completed the assessment
- Session: Test session identifier (applicable to interim assessments only)
- Enrolled Grade: Student’s enrolled grade at the time of the assessment
- School: Student’s assigned school at the time of the assessment
- Status: The assessment status describes whether the administration condition (Manner of Administration) was Valid or Invalid. A blank Status field indicates a valid assessment status. Currently in CERS, all assessment results are reported as valid.
- Level: Student’s performance level on the assessment: Level 1, Level 2, Level 3, or Level 4
- Scale Score/Error Band: Student’s scale score and error band based on the Standard Error of Measurement (SEM) associated with that score
Student Composite Scores
When the [Composite] button is selected, the Results By Student table changes to show each student’s assessment results by Composite shown in figure 6. Return to the default view by selecting the [Overall] button.
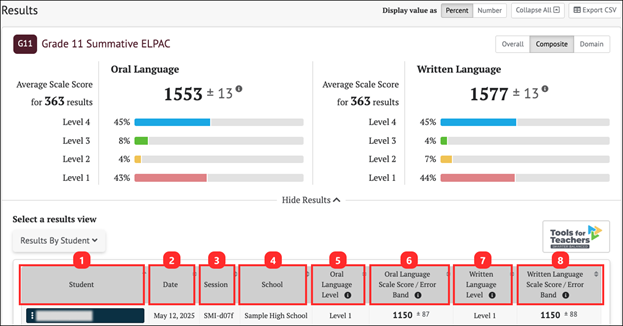
Figure 6. Summative Results By Student Composite Scores
The table includes the following information for each student:
- Student: Student’s full name with a Context Menu three-dot icon [⋮] that provides access to additional student details (refer to the Summative Student Options section)
- Date: Date student completed the assessment
- Session: Test session identifier (applicable to interim assessments only)
- School: Student’s assigned school at the time of the assessment
- Oral Language Level: Student’s performance level for Oral Language: Level 1, Level 2, Level 3, or Level 4
- Oral Language Scale Score/Error Band: Oral Language Scale Score and Error Band based on the Standard Error of Measurement (SEM) associated with that score
- Written Language Level: Student’s performance level for Written Language: Level 1, Level 2, Level 3, or Level 4
- Written Language Scale Score/Error Band: Written Language Scale Score and Error Band based on the Standard Error of Measurement (SEM) associated with that score
Student Domain Scores
When the [Domain] toggle is selected, the Results By Student table changes to show each student’s assessment results by Domain (figure 7).
The Student Domain Score Distribution table displays the number/percentage of students scoring in each reporting category (Beginning to Develop, Somewhat/Moderately, or Well Developed) for each Domain.
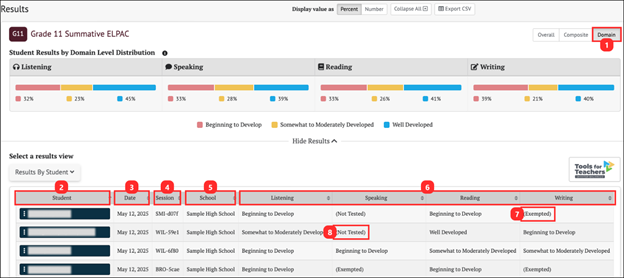
Figure 7. Summative Results By Student Domain Scores
The table includes the following information for each student:
- [Domain] toggle: When this toggle is selected, the Student Results by Domain Level Distribution will display.
- Student: Student’s full name with a Context Menu three-dot icon [⋮] that provides access to additional student details (refer to Summative Student Options section)
- Date: Date student completed the assessment
- Session: Test session identifier (applicable to interim assessments only)
- School: Student’s assigned school at the time of the assessment
- ELPAC Domains: Student performance level for each domain is described as Beginning to Develop, Somewhat/Moderately, or Well Developed
- Domain Exemption: If an EL student has a documented disability that impedes their ability to test in one or more domains, “Exempted” is displayed.
- Not Tested: If an EL student fails to log on and complete a particular ELPAC domain assessment, “Not Tested” is displayed.
Domain Indicator
If a student does not have a score for a specific Summative ELPAC domain, the results will be indicated as Exempted, which is a domain exemption, or Not Tested.
The student’s Overall Summative ELPAC score is based on results from four domains: Reading, Writing, Listening, and Speaking unless they receive a domain exemption.
Exempted
If an EL student has a disability that precludes assessment of the student in one or more domains, such that there are no appropriate accommodations for the affected domain(s), and it is documented in their Section 504 plan or IEP, the student may receive a domain exemption, which is displayed in CERS as “Exempted” (element 7, figure 7).
The student’s Overall Summative ELPAC score is based solely on the remaining assessed domains.
Not Tested
If an EL student fails to log on and complete a particular ELPAC domain assessment, CERS will display “Not Tested” for that domain (element 8, figure 7). The student will receive a score of zero for that domain.
The student’s Overall Summative ELPAC score is based on results from each domain, including the zero score(s).