Accessing Assessment Results
There are two buttons in the Assessment Results by Student and Grade page that allow users to access assessment results: [Export CSV] and [Printable Reports].
Export CSV
The [Export CSV] button (element 2, figure 9) generates a CSV file for a download containing all the student’s test history for the selected school year, subject(s), and assessment type(s). An example of this file that opened in Microsoft Excel is shown in figure 3.
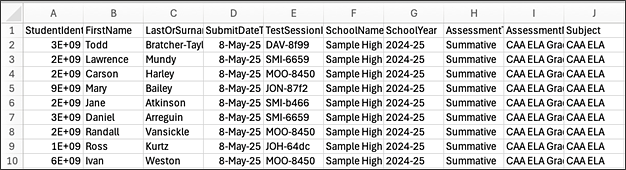
Figure 1. CSV File Opened in Microsoft Excel
Printable Reports
The [Printable Reports] button opens a pop-up menu (figure 2) allowing users to generate and download Individual Student Reports (ISRs) in PDF format of student assessment results.
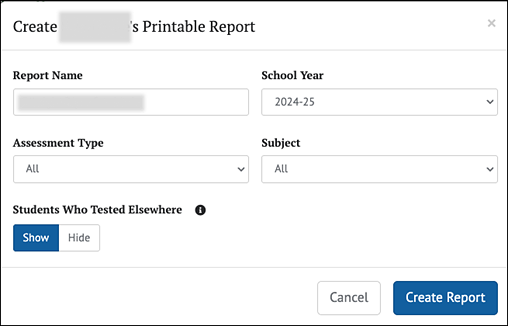
Figure 2. Printable Reports Pop-up Menu
The selections available for assessment type, subject, and school year are limited by system configuration. The report’s name defaults to the student’s name but can be modified to define the report more clearly if preferred.
The Students Who Tested Elsewhere option may be selected to either show or hide student assessment results from schools outside the user’s assigned institutions. Users can exclude those assessments by selecting the [Hide] toggle when generating a report.
Selecting the [Create Report] button will create the report based on the selections in the pop-up menu. Refer to the My Reports section for how to download and view the report.
Based on a user’s role, there are several tools available to search for assessment results quickly on the Home Page (refer to the User Roles and Permissions section): Search by Student, Search by School, and Assigned Groups and My Groups.
Search by Student
The Search by Student panel (figure 3) is available on the Home Page to quickly search for a specific student using the Statewide Student Identifier (SSID). The Search by Student panel is available to all user roles. However, for teachers it will only display results for the students in their assigned groups.
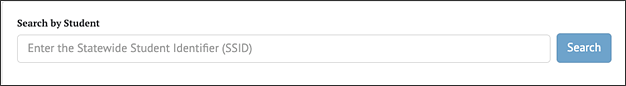
Figure 3. Search by Student
To search for a student:
- Enter the student’s SSID into the box. The full SSID must be entered to search for a student.
- Select the [Search] button (or select [Enter] on the keyboard).
If the SSID matches a student record with available assessment results and the user has permission to view that student’s information, the Student Test History Report page will display (figure 4).
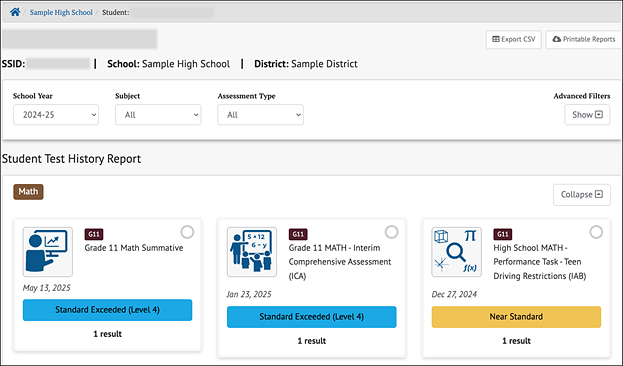
Figure 4. Student Test History Report Page
If the SSID does not yield test results, either the SSID is incorrect, the user does not have permission to view that student’s information, or there are no test results available for the student. A message will be displayed (figure 5).
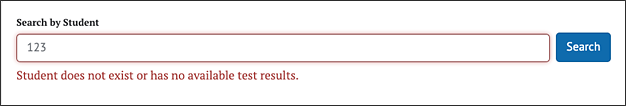
Figure 5. Search By Student Message When Results Are Not Found
Refer to the Student Test History Report section for more information about this view.
View Individual Student Results
Individual student results can be accessed from the Home Page using the Search by Student function.
They can also be accessed from any group/school results view by selecting a student’s name and selecting [Student’s Test History] from the Context Menu three-dot icon [⋮] (figure 6). Refer to the Accessing Assessment Results section for more information.
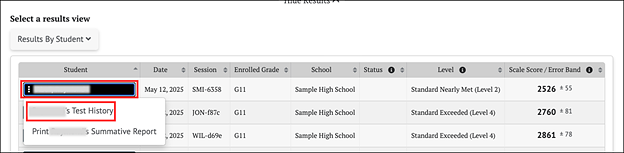
Figure 6. Context Menu to View Individual Student’s Test History
Student Test History Report
Once a student’s test history report has been selected, the Student Test History Report page is displayed for that student (figure 7). This view displays available assessment results that meet the selected criteria.
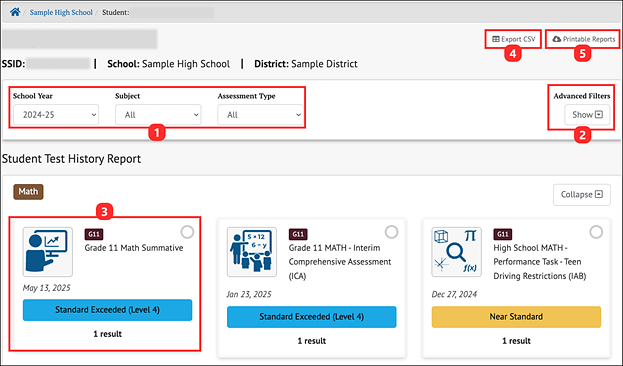
Figure 7. Student Test History Report Page
In addition to identifying the selected student and the student’s SSID, the Student Test History Report page includes the following elements:
- School Year, Subject, Assessment Type filters: Choose specific school years, subjects, and assessment types to display, or choose “All” from the drop-down menus to see all the years, subjects, or assessment types for which assessment results exist for the student.
- Advanced Filters: Show or hide a filter panel to more precisely select which assessment results to view.
- Student Test History Report panel: Displays assessments that match the school year, content area, assessment type.
- [Export CSV] button: Export all the student’s test history to a comma-separated value (CSV) file for download.
- [Printable Reports] button: Select and download Individual Student Reports (ISRs) in PDF format.
Advanced Filters for Assessments
The [Advanced Filter] button on the Student Test History Page (element 2, figure 7) opens the Advanced Filters panel for assessments (figure 8).
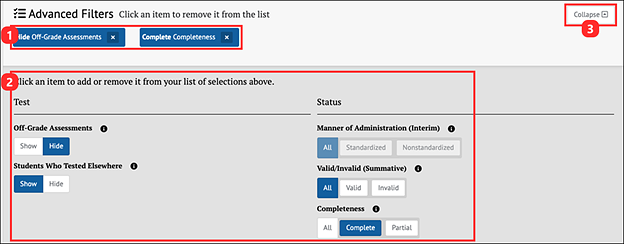
Figure 8. Advanced Filters Panel for Assessments
The elements available in the Advanced Filters for assessments are shown in figure 8. Changes to the filter criteria immediately modify the list of assessment results displayed.
- Currently selected filters: Selecting the [Remove] “x” icon [⨉] removes a filter from the Assessment Filters panel.
- The Assessment Filters panel, which includes:
- [Off-Grade Assessments] toggle (for interim assessments only): Indicates that a student took an assessment for a grade other than the student's assigned grade. This filter is only applicable for interim assessments.
- [Manner of Administration] toggle (for interim assessments only): Indicates how the assessment was administered (Standardized or Non-standardized) in terms of protocols and security procedures.
- [Valid/Invalid] toggle (for summative assessments only): Indicates the condition under which an assessment is administered. Currently in CERS, all assessment results are reported as valid.
- [Completeness] toggle: Indicates whether the assessment results meet the definition of complete. The default is [Complete], but it can be toggled to [Partial] for partial assessments or to [All] to generate a report that includes results from assessments that are either complete or partial. Summative and Interim Comprehensive Assessment (ICA) tests are considered “complete” if the student responded to all items on both the computer adaptive test (CAT) and performance task (PT). Interim Assessment Blocks (IABs) and Focused IABs (FIABs) are considered complete if the student answered all items in the test.
Student Test History Report Results
The Student Test History Report results (figure 7) are displayed in a dashboard format with each assessment that matches the selectors and advanced filters appearing as a separate card. A sample card is pictured in figure 9.
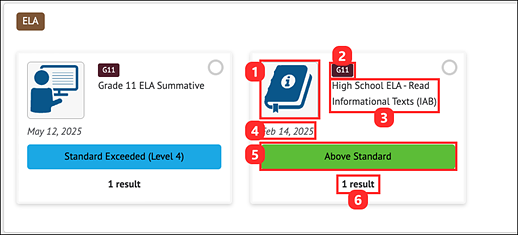
Figure 9. Student Test History Report Results Card
The information presented on each Student Results Card contains:
- An icon representing the assessment subject or topic
- An icon for the grade level of the assessment
- The name of the assessment
- The date the assessment was administered
- The student’s achievement level, performance level, or reporting category for the assessment
- The number of results available for the assessment
Selecting anywhere within a Student Results Card displays a table of additional information below the card. Depending on the type of assessment chosen, this table contains slightly different information.
For IAB assessments, the table appears as it does in figure 10.
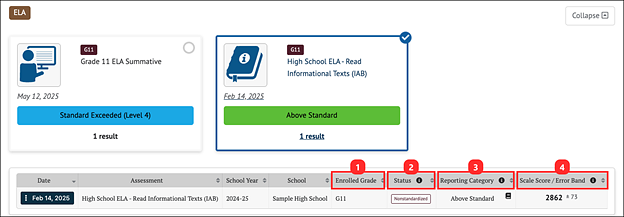
Figure 10. Student IAB Results Table
In addition to the information displayed in the card, this IAB Results table displays:
- Enrolled Grade: Student’s enrolled grade when the student took the assessment.
- Status: The status (Standardized, Non-standardized, or Partial, Complete) of each result, if applicable.
- Reporting Category: The IAB reporting category is reported as one of three ranges of scale scores: Above Standard, Near Standard, or Below Standard. Refer to the CERS Interpretive Guide for more information about the reporting categories.
- Scale Score/Error Band: Student’s Scale Score/Error Band of each result. The student’s error band is based on the standard error of measurement (SEM) associated with the score.
Selecting the date in the Context Menu three-dot icon [⋮] brings up the menu with additional links to specific information that may be available, as shown in figure 13.
For ICAs and summative assessments, the Overall view of this table is similar to the IAB table but includes the student’s achievement or performance level on the assessment based on the scale score.
The ICA and summative assessments table also includes buttons to toggle the scores between the default Overall view and, if available, Composite, Claim, Domain, Lexile, or Quantile scores. Selecting the button changes the view to show student’s results in the selected option, as shown in figure 11.
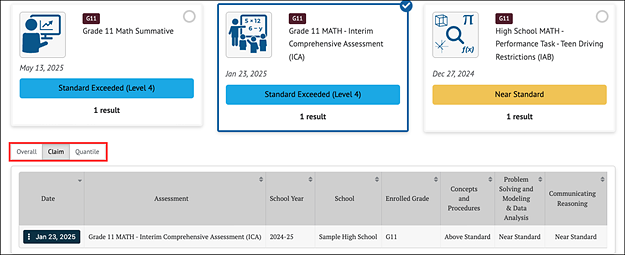
Figure 11. Table Toggle for Math ICA
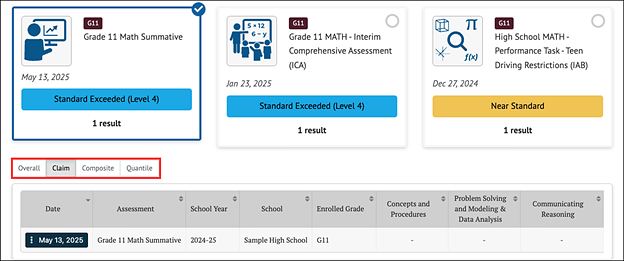
Figure 12. Table Toggle for Math Summative
In figure 11 and figure 12, the ICA and Summative assessment claim results are provided for Concepts and Procedures, Problem Solving and Modeling & Data Analysis, and Communicating Reasoning. Claim results are reported as Below Standard, Near Standard, and Above Standard. Refer to the CERS Interpretive Guide for additional information.
Selecting the [Overall] button returns to the default Overall view.
Student Test History Report Details Menu
Each row in the Student Test History Report displays a Context Menu by selecting the three-dot icon [⋮] that provides access to additional information, as shown in figure 13.
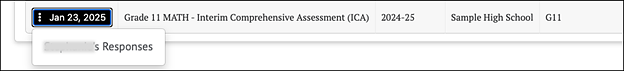
Figure 13. Student History Report ICA Context Menu
For all interim assessments, this menu allows the user to view the student’s item responses (refer to the Interim Assessments section) for the selected interim assessment. For IAB/IA results, the menu also includes a link to Instructional Resources, such as the Smarter Balanced Connections Playlists in the Smarter Balanced Tools for Teachers website (ELA and math IABs and FIABs), Smarter Balanced Tools for Teachers home page (CAST and ELPAC IAs), or any instructional resources uploaded by the user’s LEA. For summative assessments, this menu is disabled.
Student Responses for Interim Assessments
The Student’s Responses table includes an individual student’s responses to interim assessment items, as shown in figure 14. This table is available from the Student’s Test History Report page and from the Results page for groups or schools. Refer to the Interim Assessments section for more details.
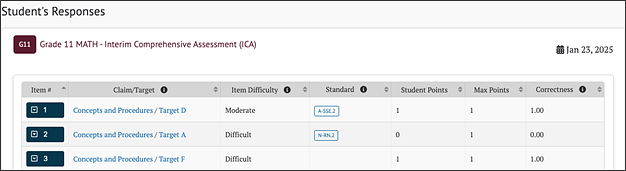
Figure 14. Student Responses
Selecting an interim assessment item’s down arrow icon [⌄] expands the row to provide additional item details (figure 15).
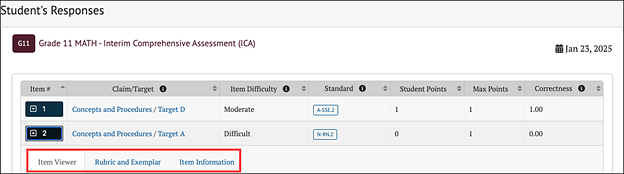
Figure 15. Student Responses with Expanded Row Showing Additional Item Details
- The [Item Viewer] tab displays the interim assessment item as it appeared on the test and the student’s response. The item number is shown at the top left for the item being viewed. This view is read only; there are no user-editable fields.
- The [Rubric and Exemplar] tab functions as described in the Rubric and Exemplar section.
- The [Item Information] tab functions as described in the Item Information section.
Search by School
If the user’s TOMS role permissions allow access to student results at the school level, the Search by School panel is available on the Home Page (figure 15) to allow quick access to assessment results by school and grade.
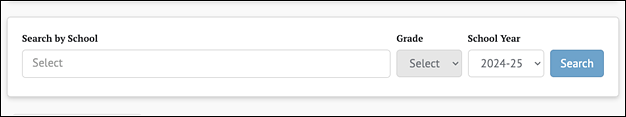
Figure 16. Search by School Panel
To search for a school:
- Type the name of the school in the Search by School search box to activate the name drop-down list. Schools to which the user is assigned are listed alphabetically by name and grouped by district.
-
Scroll through the complete list to select a school or enter the name of a school in the search box to find a specific school. As a user types, the drop-down list of schools is filtered to only show school names that have matching text anywhere in the name, as shown in figure 17.
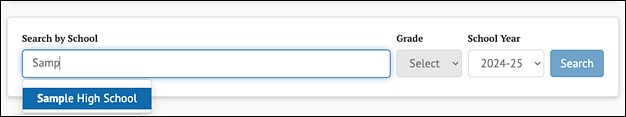
Figure 17. Search by School Search Box
- Select the name of a school to view student results for that school.
-
If results are available for more than one grade at the school, select the desired grade using the Grade drop-down list, as shown in figure 18. If only one grade is available, it will be selected.
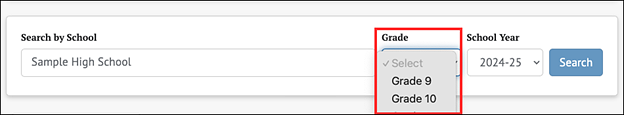
Figure 18. Grade Drop-Down List
- Select the [Search] button to search for assessment results for the selected school, grade, and school year.
- If results are available, the Assessment Results page with the default assessment will be shown.
-
If no results are available, a message will be displayed on the Assessment Results page, as shown in figure 19.
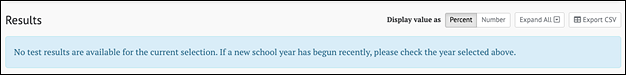
Figure 19. Search by School “No Results” Message
After selecting a school from the Search by School function, a user does not need to return to the Home Page to search for a new school. The Results by School and Grade panel appears after school, grade level, school year, and search have been selected on the home page. The Results by School and Grade panel allows the users to search for a new school, grade, or school year (element 1, figure 20).
View Student Assessment Results by School and Grade
Assessment results by school are accessed by using the Search by School panel. If the user’s TOMS role permissions allow access to student results at the school level, the Search by School panel is available on the Home Page. Selecting a school and grade for which assessment results exist displays the results page. Figure 20 shows the top panel on that page.
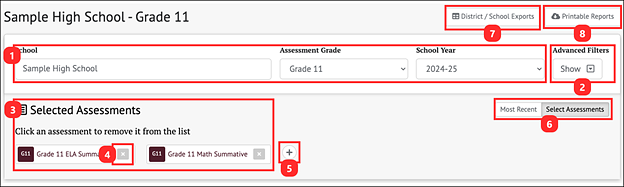
Figure 20. Results by School and Grade Panel
This panel allows users to change the view of selected assessment results by:
- Changing the School, Assessment Grade, or School Year from which to select assessments
- Showing or hiding the Advanced Filters panel
- Selecting one or more assessment(s) in the [Selected Assessments] panel. Refer to the Selected Assessments section for details.
- Removing a selected assessment by selecting the [Remove] “x” icon, [⨉].
- Adding assessments to the [Selected Assessments] panel by selecting the [Add] plus sign “+” icon, [+]
- Toggling between only the [Most Recent] assessments or [Selected Assessments]
- Exporting a CSV file of assessment results for one or more schools or districts. Refer to the District/School Exports section for details.
- Printing a download of Individual Student Reports of the selected assessments in PDF format. Refer to the Printable Reports section for details.
Advanced Filters for Assessments and Student Demographics
The Advanced Filters for assessments and student demographics panel (figure 21) allows users to filter the assessment results to view only selected types of assessments and status, or to view only students with selected demographics.
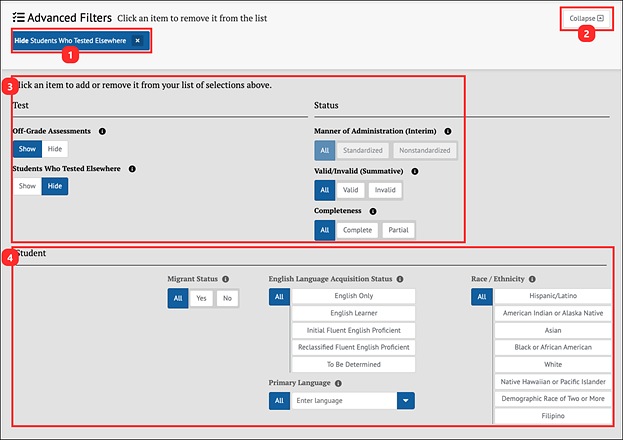
Figure 21. Advanced Filters for Assessments and Student Demographics Panel
The elements available in the Advanced Filters for assessments and student demographics panel are shown in figure 21. Changes to the filter criteria immediately modify the list of assessment results displayed.
- Currently selected filters: Select the [Remove] icon “x” [⨉] to remove the filter. If the area is blank, no filters have been selected.
- [Collapse] toggle: Collapse the bottom part of the panel (elements 3 and 4 in figure 22), leaving only the selected filters displayed.
- Test and Status assessment filters: Select values to reduce the list of students to just those that match those values. Select “All” for a field to clear the filter for that field.
- Student filters: In CERS, these include: Race/Ethnicity, English Language Acquisition Status, (Primary) Language, and Migrant Status. Select values to reduce the list of students to just those that match those values. Select “All” for a field to clear the filter for that field.
Selected Assessments
By default, the system displays the most recent assessment for the selected school, grade, and school year, and the [Most Recent] button is selected. Selecting the [Select Assessments] button or the [Add] plus sign “+” icon [+] opens a lower panel that displays all available assessments, as shown in figure 22.
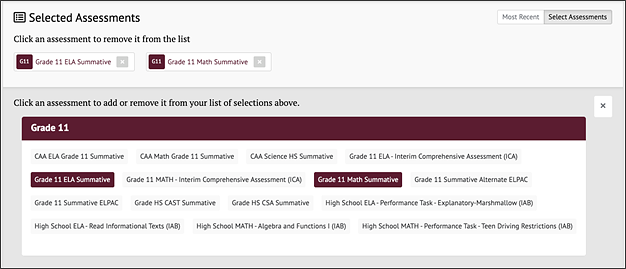
Figure 22. Displaying All Available Assessments Panel
Each available assessment functions as a toggle to include in the Results panel or remove it. Selecting an assessment in the lower panel adds it to the list of Selected Assessments in the upper panel and adds its results to the Results panel, as shown in figure 23. Reselecting the assessment removes it from the upper panel and the Results panel. Refer to the Interim Assessments and Summative Assessments sections for details describing the information that will display based on assessments chosen.
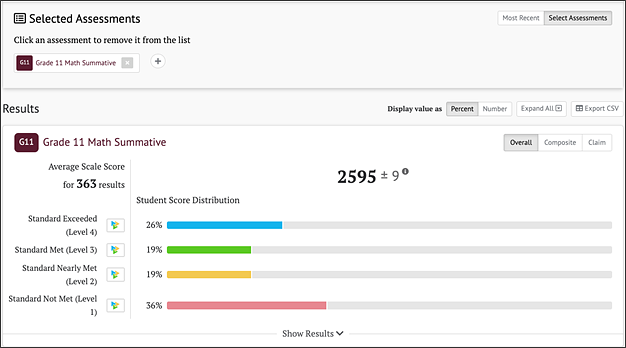
Figure 23. Selected Assessments Results Panel
Student Assessment Results Printable Reports
The [Printable Reports] button (element 5, figure 7) opens a pop-up menu (figure 24) allowing users to create a PDF of Individual Student Reports (ISRs) for a group of students. An ISR is produced for each student by selected assessment type and subject, and the ISR provides a summary of the student's assessment results with details for each assessment selected in the filters. The results on ISRs are one indicator of the student's performance and should be used along with other information, such as classwork and other assessment results, when making educational decisions.
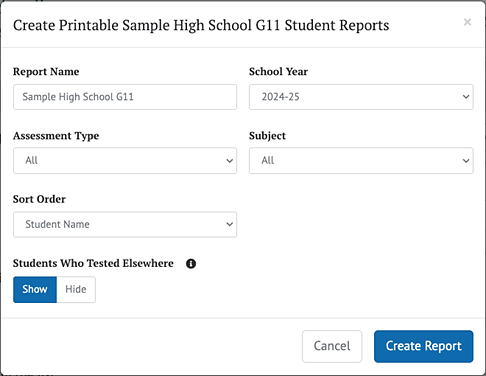
Figure 24. Printable Reports Pop-Up Menu
The pop-up menu for the printable report is the same for an individual student or group of students, but for a group of students it has an additional sort-order option. The system limits the selections available based on the subject(s), assessment type(s), and school year(s) that have been established in CERS.
The report’s name defaults to the group’s name but can be modified to define the report more clearly if preferred. The Students Who Tested Elsewhere option may be toggled to either show or hide any assessments students took outside of the user’s assigned institutions during the selected school year.
Selecting the [Create Report] button will create the report for the selections in the pop-up menu. Refer to the My Reports section for details on printing and viewing the report.
Assigned Groups and My Groups
The Assigned Groups and My Groups panel (figure 25) is available on the Home Page to allow quick access to assessment results for groups of students to whom the user is assigned.
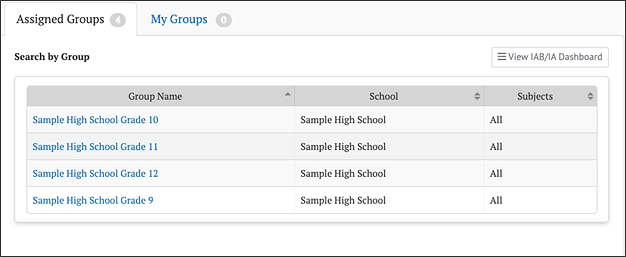
Figure 25. Assigned Groups Panel
No Groups Shown
A message will be shown if no groups are available (figure 26). This could be because there are no assigned groups to the user, there was an error in the student group file upload, or the email used to create the group does not match the user’s account. Refer to the Manage Student Groups section for more details.
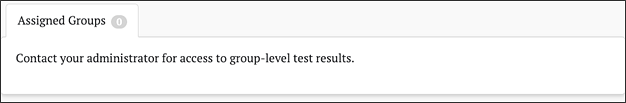
Figure 26. No Assigned Groups Available to Current User Message
Select Group Name to View Results
Selecting a [Group Name] in the list (figure 27) takes users to the Student Group Assessment Results page for that group. This is true whether the group is selected from the Assigned Groups panel or one of the customized groups from the My Groups panel.
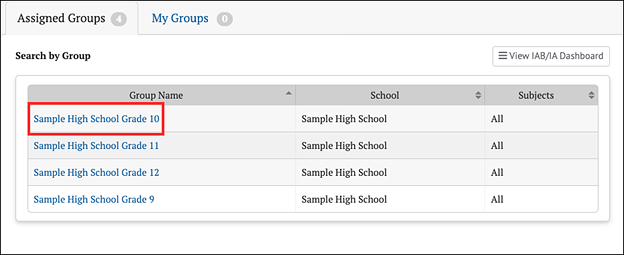
Figure 27. Group Name for Selection
Searching Assigned Groups
If there are many groups assigned to the user, a live search box appears above the list to assist in finding the desired group (figure 28).
To search for a group:
- Begin entering the name of a group in the Search by Group Name box.
- The list of groups displayed will automatically filter to only show groups that match the characters entered.
- Select the desired group from the filtered list.
If the search entered does not match any of the user’s assigned groups, then a message will display (figure 28).
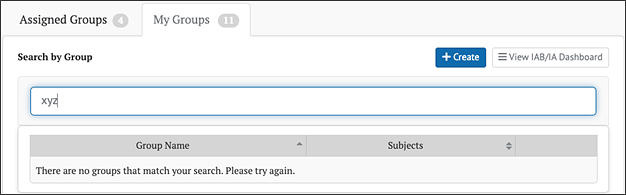
Figure 28. No Groups Match Search Message
Searching My Groups
Teachers may create customized groups of students based on the students assigned to them by an administrator, as found in the Assigned Groups panel. The teacher-created groups display in a second tab called [My Groups] next to the [Assigned Groups] tab (figure 29). Search functionality for the My Groups panel is identical to the Assigned Groups panel. Refer to the Creating My Groups section for instructions on creating customized groups.
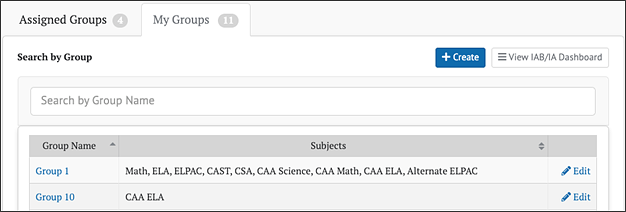
Figure 29. My Groups Panel
Creating My Groups
Teachers can create customized groups of students that appear in the Assigned Groups panel by selecting the [+ Create] button on the My Groups panel. This displays the New Group definition screen (figure 30).
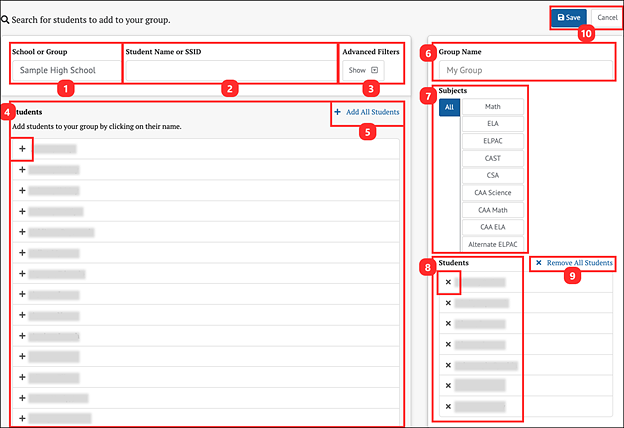
Figure 30. New Group Definition Screen
Use the New Group definition screen to create a new group.
- School or Group: Select a group from the School or Group entry box. Selecting this box displays a drop-down list of all assigned groups. Typing directly into the box activates a live search to filter this list. If there are multiple assigned groups, select the group from which the new group will be created.
- Student Name or SSID: If necessary, filter the student list by entering characters into the Student Name or SSID box. It is enabled for live search and filters the student list by matching the entered characters.
- Advanced Filters: Advanced Filters for student demographics may also be used to filter the student list. Refer to the My Groups Advanced Filters for Student Demographics section for instructions on applying advanced filters.
- Students panel: In the Students panel, select the students you want to add to the new group. The added students will appear on the Students list in the panel on the right of the page (element 8, also shown in figure 33).
- Add All Students: Select [+ Add All Students] to add all the students in the assigned group to the new group.
- Group Name: Name the new group by entering a name into the Group Name box in the right panel.
- Subjects: Select the tested subjects for the group.
- Students: The Students panel on the right will be populated with the list of students added to the selected group.
- Remove All Students: Remove any students added to the new group by selecting the students’ names in the new Students list (element 8) in the panel to the right of the page. Select [⨉ Remove All Students] (also shown in figure 33) to clear the list and start over.
- [Save] and [Cancel] buttons: Select the [Save] button to create the new group or select the [Cancel] button to cancel creating a new group and return to the My Groups list.
Before saving, the completed right panel should include the name, subject, and students’ names (figure 31).
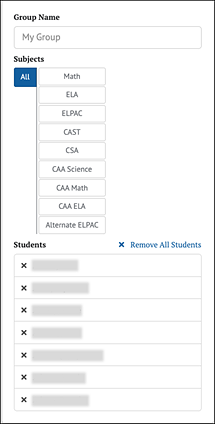
Figure 31. Completed New Group Definition Screen
After the new group is saved, it is displayed in the list in the My Groups panel on the Home Page (figure 32).
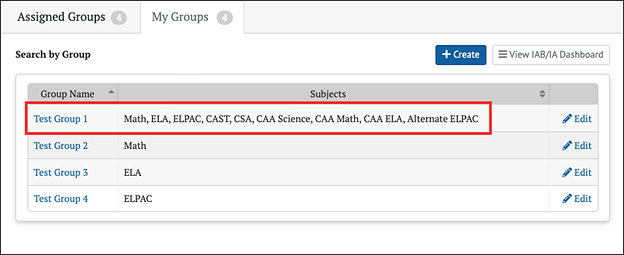
Figure 32. New Group Added to My Groups Panel
A group may be edited by selecting the [Edit] button in its row. The edit screen also contains a [Delete] button, which allows the user to delete the new group from the system.
Alert: Deleting a custom group is permanent and cannot be undone.
My Groups Advanced Filters for Student Demographics
Advanced filters for student demographics can ease the task of selecting students for the custom groups in My Groups. Selecting the [Show] button under the Advanced Filters for student demographics panel on the New Group page opens the subgroup filter controls (figure 33).
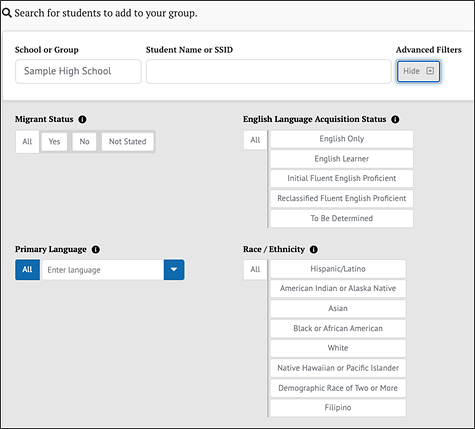
Figure 33. New Group Page—Advanced Filters for Student Demographics
These controls can be used to filter the list of students from the selected assigned group. Only the students who match the configured filters will display. This makes it easier to identify and select students by subgroup. When filters are selected, the [Show/Hide] button displays a number indicating the number of configured filters. This number persists even when the Advanced Filters panel is toggled back to hidden. Note that student data may change in CERS when a student transfers or when a new test event occurs.
View Student Group Assessment Results
Assessment results for student groups are accessed by selecting a group using the Assigned Groups or My Groups panels. Once a group has been selected, the results for that group are displayed. The way results are displayed varies by the type of assessment, but all results have the Groups panel, as shown in figure 34.
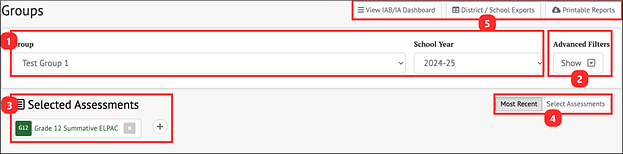
Figure 34. Groups Panel
Use the Groups panel to:
- Select a different student group or school year for which to view results
- Use the [Show] or [Hide] buttons to display the Advanced Filters panel to precisely select which results to view
- Add one or more Selected Assessments for which to view results. Selected Assessments works as described in the Selected Assessments section.
- Toggle between viewing results for the [Most Recent] assessment administered to students in this group or [Select Assessments]
- Navigate to the IAB/IA Dashboard page, the District/School Exports page (if applicable to the user’s TOMS role), or download PDF reports of assessment results for students in the selected group
Refer to the following sections for details:
- IAB/IA Dashboard
- District/School Exports
- View Student Group Assessment Results
- Interim Assessments for details describing the information that will display based on assessments chosen
- Summative Assessments for details describing the information that will display based on assessments chosen