

CSA 3-8 Results
CSA 3-8 Results in Group View
The group view for the California Spanish Assessment for grades 3-8 (CSA 3-8) provides an aggregate and individual display of a selected assessment for an assigned group, a custom group, or a school. Refer to the View Student Assessment Results by School and Grade section or the View Student Group Assessment Results for details.
Once a user selects a CSA 3-8 assessment to display in the group view, the Results page displays as shown in figure 1.
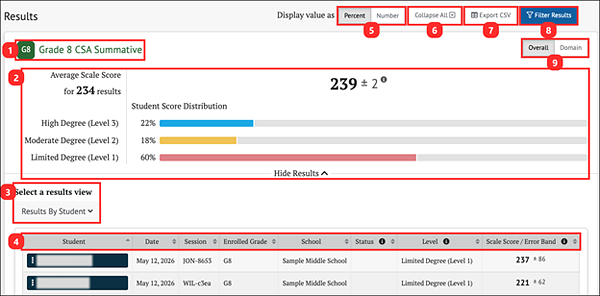
Figure 1. Summative Results Panel for CSA 3-8
The Results page for the CSA 3-8 displays the following information and elements:
- Name and grade of the assessment
- Group Aggregate panel: Displays the aggregate data for the selected group of students
- Select a results view drop-down menu: Offers the following options for display results:
- [Results By Student]
- Results View table
- Display value as field: Contains a toggle allowing a user to change the display to show the Student Score Distribution in percentages of students or numbers of students in each range
- [Collapse All] button: Hides the Results by Student table for all the displayed assessments and toggles to an [Expand All] button, which displays the results again
- [Export CSV] button: Exports all the student’s test history to a comma-separated value (CSV) file for download.
- [Filter Results] button: Filters what displays in the Results View table for the assessment and the results.
- [Overall/Domain] toggle: Switches among Overall and Domain
- [Overall] toggle: Displays the Student Score Distribution with three achievement levels.
- [Domain] toggle: Displays three domains, each with three reporting categories.
CSA 3-8 Group Results
The CSA 3-8 reports an average overall performance score.
The group Results page for a CSA 3-8 is displayed in figure 2.
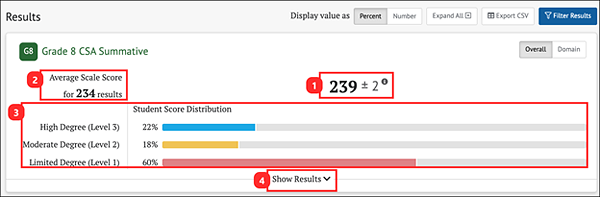
Figure 2. Group Results for CSA 3-8
The Group Aggregate panel for CSA 3-8 displays the following information and elements:
- Average Scale Score: Average scale score for the selected group of students and an error band based on the Standard Error of the Mean
- Number of student test results from which the average scale score and score distribution are calculated
- Student Score Distribution: Score distribution for the ranges of the overall score
- [Show Results] button: Displays the Results View table for the displayed assessment and toggles to a [Hide Results] button that hides the table
CSA 3-8 Results By Student
Student Overall Scores
The Results By Student table includes the information elements for each student shown in figure 3.
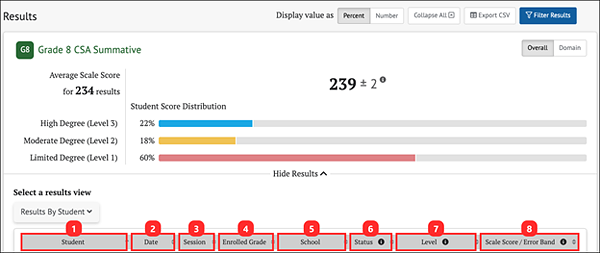
Figure 3. CSA 3-8 Results By Student Overall Scores
The table includes the following information for each student:
- Student: Student’s full name with a three-dot icon [⋮] context menu that provides access to additional student details (refer to the Summative Student Options section)
- Date: Date student completed the assessment
- Session: Test session identifier (applicable to interim assessments only)
- Enrolled Grade: Student’s enrolled grade at the time of the assessment
- School: Student’s assigned school at the time of the assessment
- Status: Indicates if an interim assessment was administered (Manner of Administration) in a standardized or nonstandardized manner, or as partially complete (Completeness). For a summative assessment, it indicates a test as partially complete.
- Level: Student’s overall achievement reporting range on the assessment: Range 1, Range 2, or Range 3
- Scale Score/Error Band: Student’s overall scale score and error band based on the Standard Error of Measurement (SEM) associated with that score. Only some assessments display error band.