

CSA HS Results
CSA HS Results in Group View
The group view for the California Spanish Assessment for high school (CSA HS) provides an aggregate and individual display of a selected assessment for an assigned group, a custom group, or a school. Refer to the View Student Assessment Results by School and Grade section or the View Student Group Assessment Results for details.
Once a user selects a CSA HS assessment to display in the group view, the Results page displays as shown in figure 1.
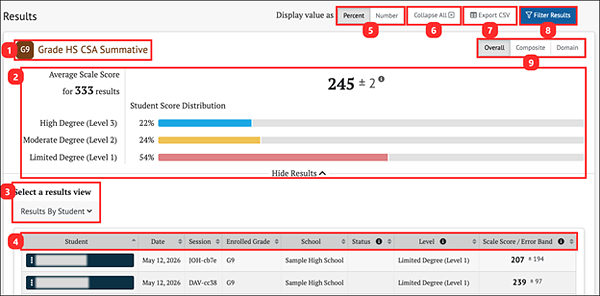
Figure 1. Summative Results Panel for CSA HS
The Results page for the CSA HS displays the following information and elements:
- Name and grade of the assessment
- Group Aggregate panel: Displays the aggregate data for the selected group of students
- Select a results view drop-down menu: Offers the following options for display results:
- [Results By Student]
- Results View table
- Display value as field: Contains a toggle allowing a user to change the display to show the Student Score Distribution in percentages of students or numbers of students in each range
- [Collapse All] button: Hides the Results by Student table for all the displayed assessments and toggles to an [Expand All] button, which displays the results again
- [Export CSV] button: Exports all the student’s test history to a comma-separated value (CSV) file for download.
- [Filter Results] button: Filters what displays in the Results View table for the assessment and the results.
- [Overall/Composite/Domain] toggle: Switches among Overall, Composite, and Domain
- [Overall] toggle: Displays the Student Score Distribution with three achievement levels.
- [Composite] toggle: Displays two composite scores: Oral Literacy and Written Literacy, each with three achievement levels.
- [Domain] toggle: Displays four domains, each with three reporting categories.
CSA HS Group Results
The CSA HS reports an average overall performance score.
The group Results page for a CSA HS is displayed in figure 2.
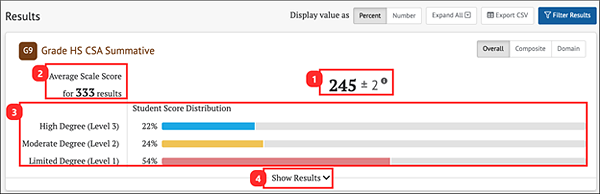
Figure 2. Group Results for CSA HS
The Group Aggregate panel for CSA HS displays the following information and elements:
- Average Scale Score: Average scale score for the selected group of students and an error band based on the Standard Error of the Mean
- Number of student test results from which the average scale score and score distribution are calculated
- Student Score Distribution: Score distribution for the ranges of the overall score
- [Show Results] button: Displays the Results View table for the displayed assessment and toggles to a [Hide Results] button that hides the table
CSA HS Results By Student
Student Overall Scores
The Results By Student table includes the information elements for each student shown in figure 3.
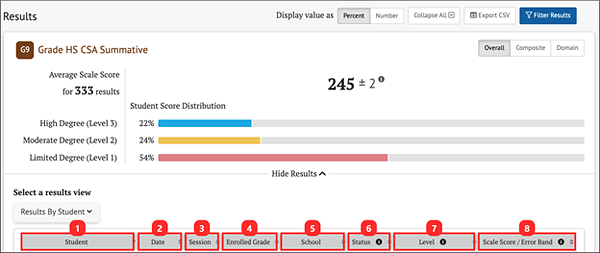
Figure 3. CSA HS Results By Student Overall Scores
The table includes the following information for each student:
- Student: Student’s full name with a three-dot icon [⋮] context menu that provides access to additional student details (refer to the Summative Student Options section)
- Date: Date student completed the assessment
- Session: Test session identifier (applicable to interim assessments only)
- Enrolled Grade: Student’s enrolled grade at the time of the assessment
- School: Student’s assigned school at the time of the assessment
- Status: Indicates if an interim assessment was administered (Manner of Administration) in a standardized or nonstandardized manner, or as partially complete (Completeness). For a summative assessment, it indicates a test as partially complete.
- Level: Student’s overall achievement reporting range on the assessment: Range 1, Range 2, or Range 3
- Scale Score/Error Band: Student’s overall scale score and error band based on the Standard Error of Measurement (SEM) associated with that score. Only some assessments display error band.